Navigate within Mergent Market Atlas using the main tab modules (Home, Company, Filings...) and the subcategories found beneath each module. For details on each of the modules and their subcategories scroll down or use the quick links above to jump to a topic
Home/Search
Search for global equities based on name, location, business classification and financial characteristics using basic and advanced search modes. Three forms of Company Search options are available in Market Atlas:
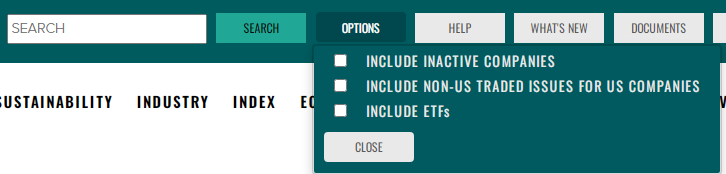
Company Name/Symbol Search - Enter a company name or symbol to view matching companies for selection. To view all search results in a table, click on the Company Search button. Note, company name/symbol searches can be conducted from the search tool at the top of every Market Atlas page.

Use the Options button to the right of the Search button to refine your search universe, including the options to include ETFs and inactive US companies in the search.
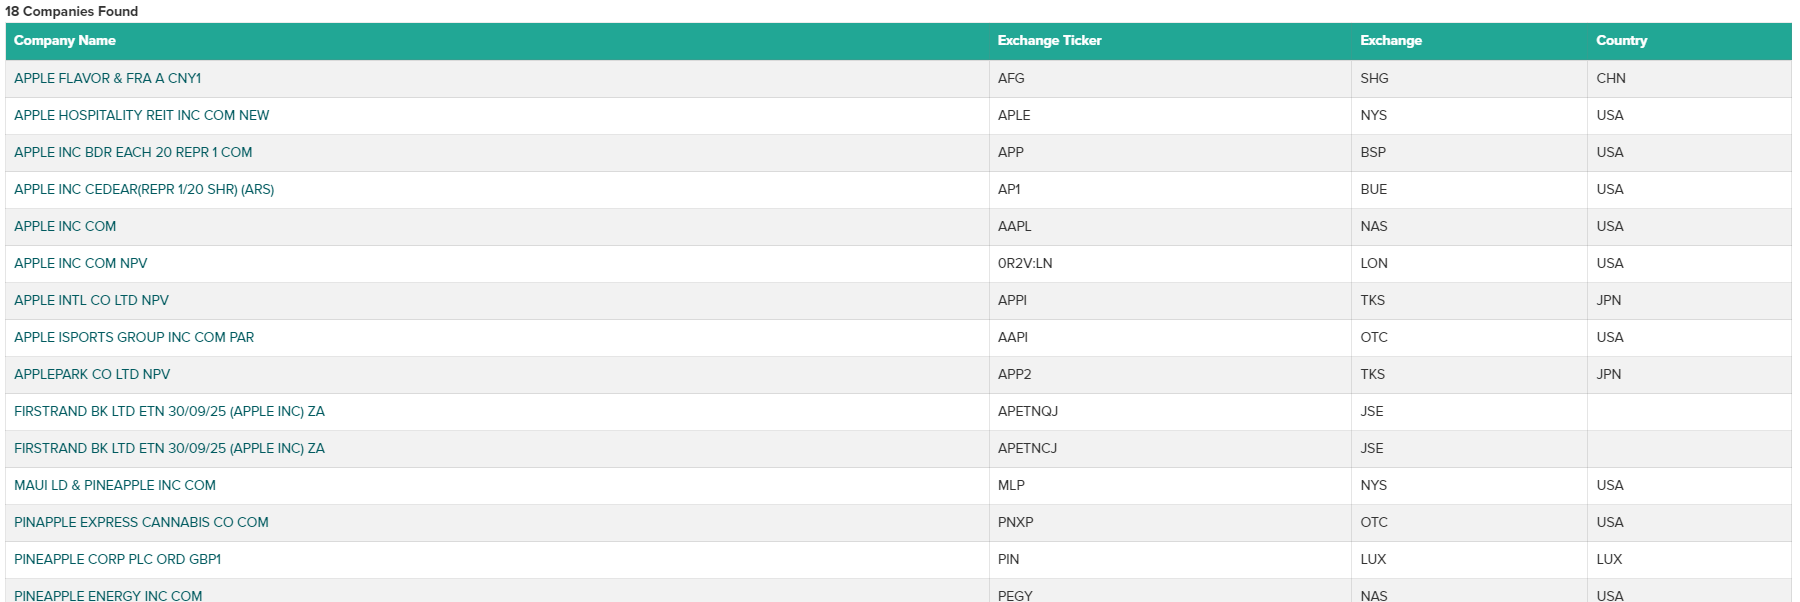
Company Search button results table:
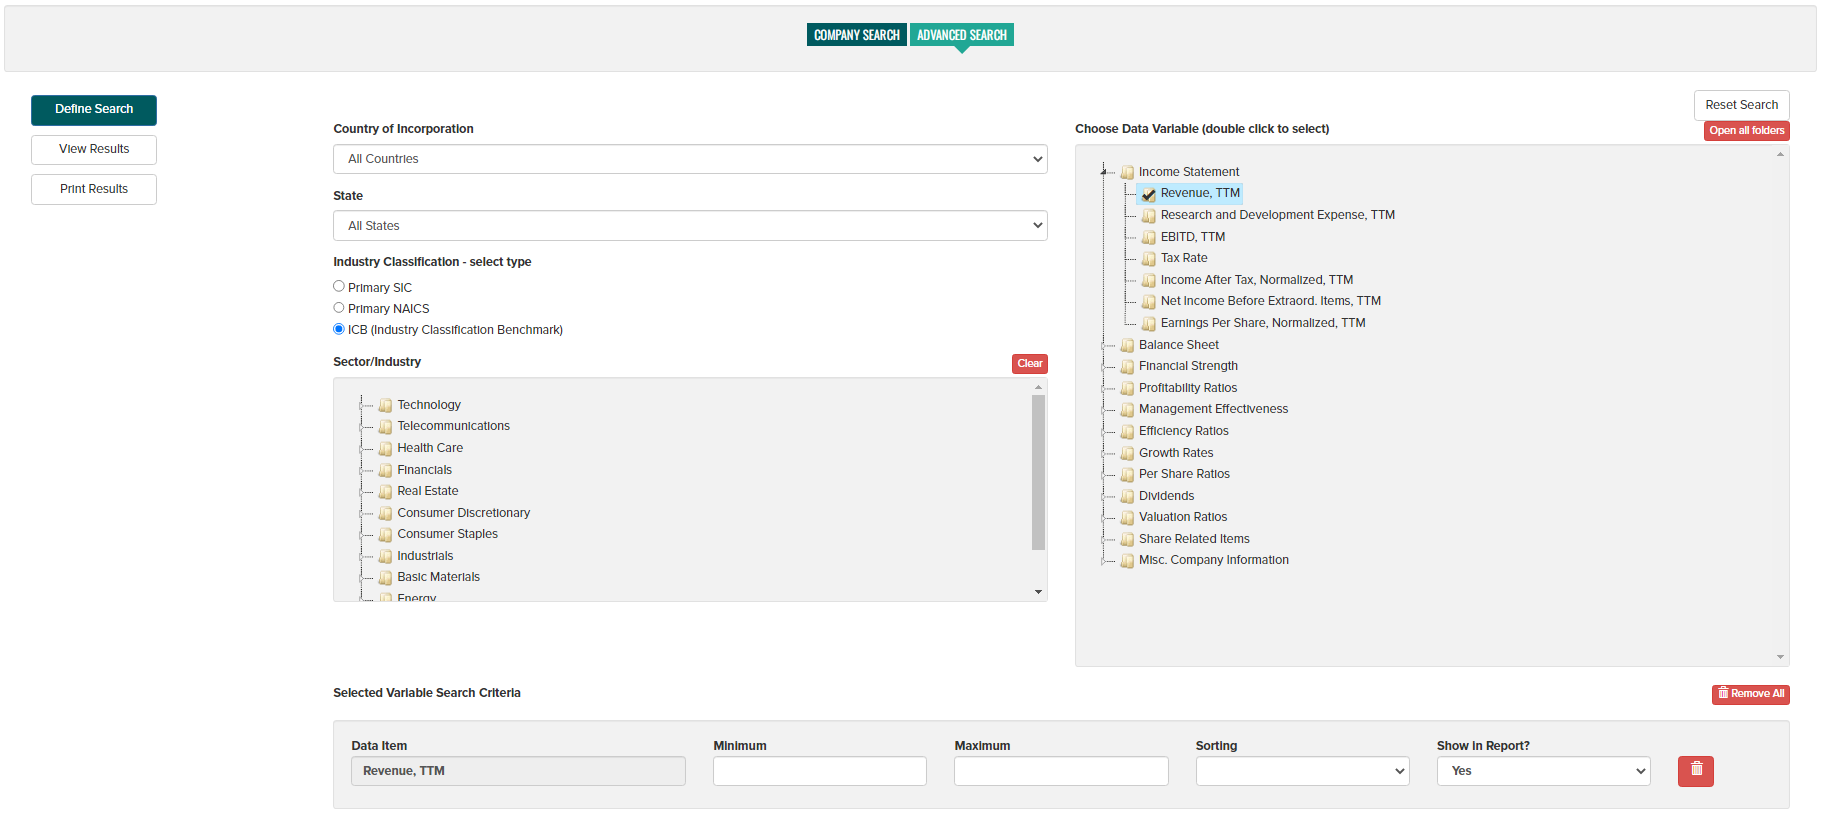
Company Characteristics Search - Select Country, State, Exchange, SIC, NAICS or ICB classification data along with optional criteria for company Revenue and Employee count. Revenue is expressed in the form of trading exchange currency. A minimum of 1 item must be selected before searching. Use the View Results button to view the passing companies.
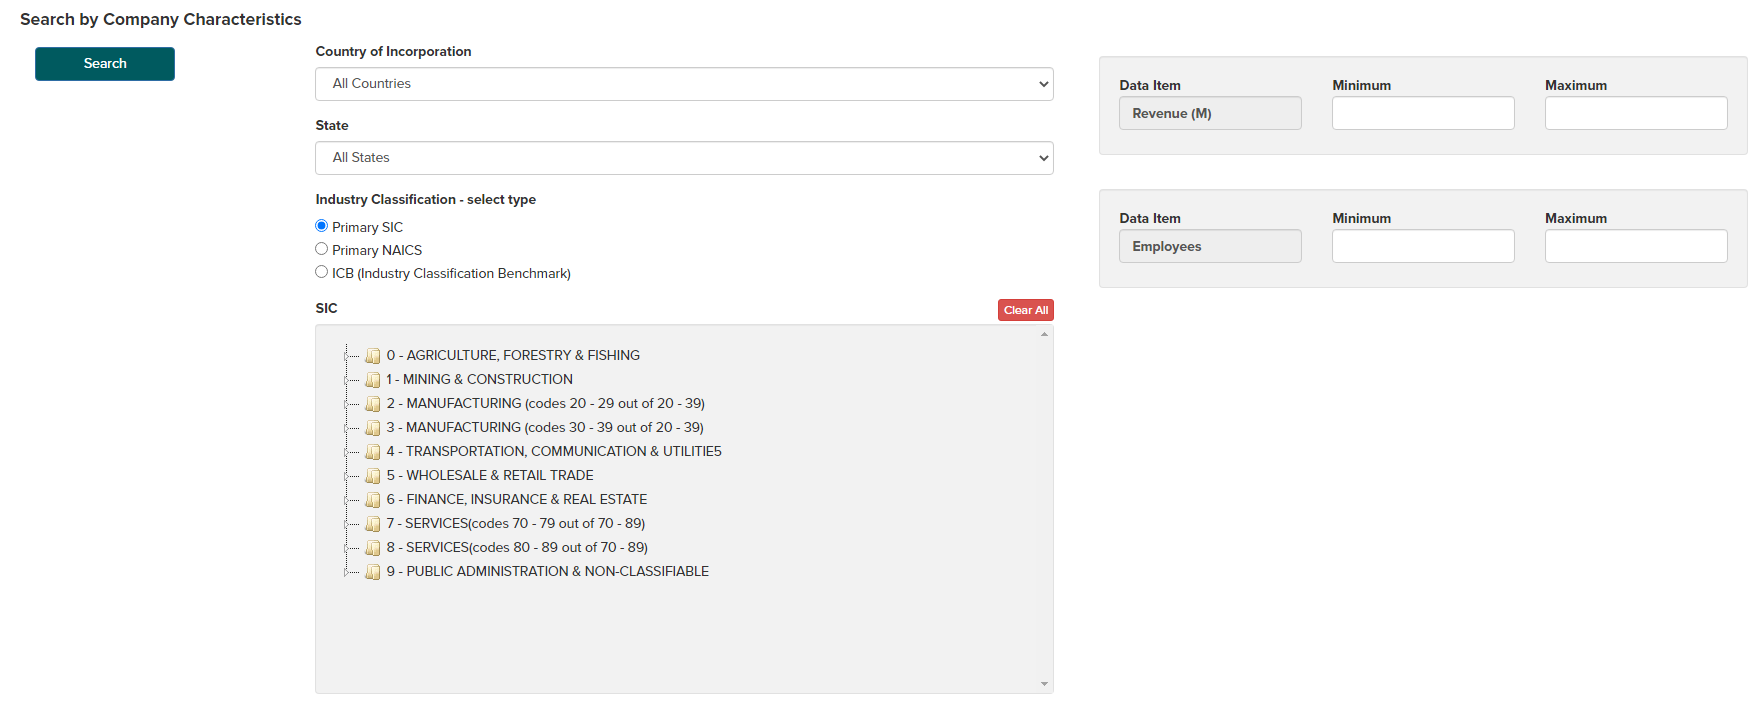
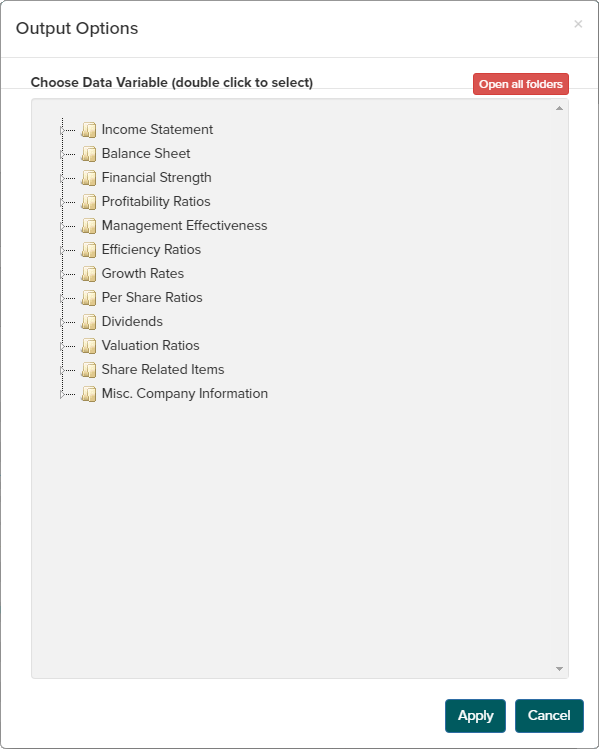
To search against additional company variables, use the Add Items button on the right side of the display. This will provide a pop-up selection tool displaying additional data items which can be chosen with a double-click, when complete, use the Apply button. Chosen data item with then be displayed where Minimum and Maximum values along with sorting preferences can be entered. Finally, use the View Results button to see passing companies in report form.
Search Results - Search results are presented in alphabetical order by company name. Click on the company symbol hyperlink to view the company overview page. Click on column headings to change sort order. Search results can be printed using the Display page for printing button and can be exported to a CSV file using the Export button. To modify a search, use the Define Search button to return to the definition page.
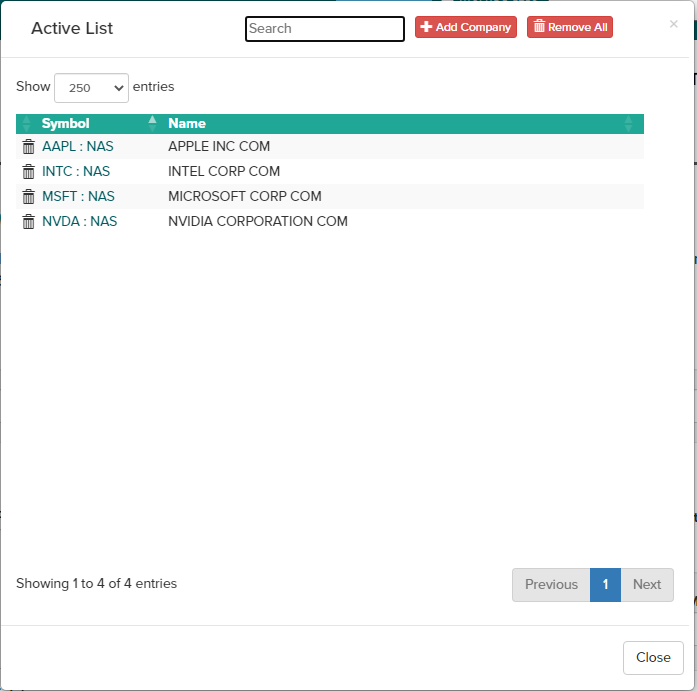
Active List - results checked can be saved to your session 'Active List' for future access within the Company module. Use the Select All or Clear All buttons or individually check/uncheck results, then use the Send to Active List button to save all checked results. The Active list can then be accessed at the top of the screen using the Show Active List button.
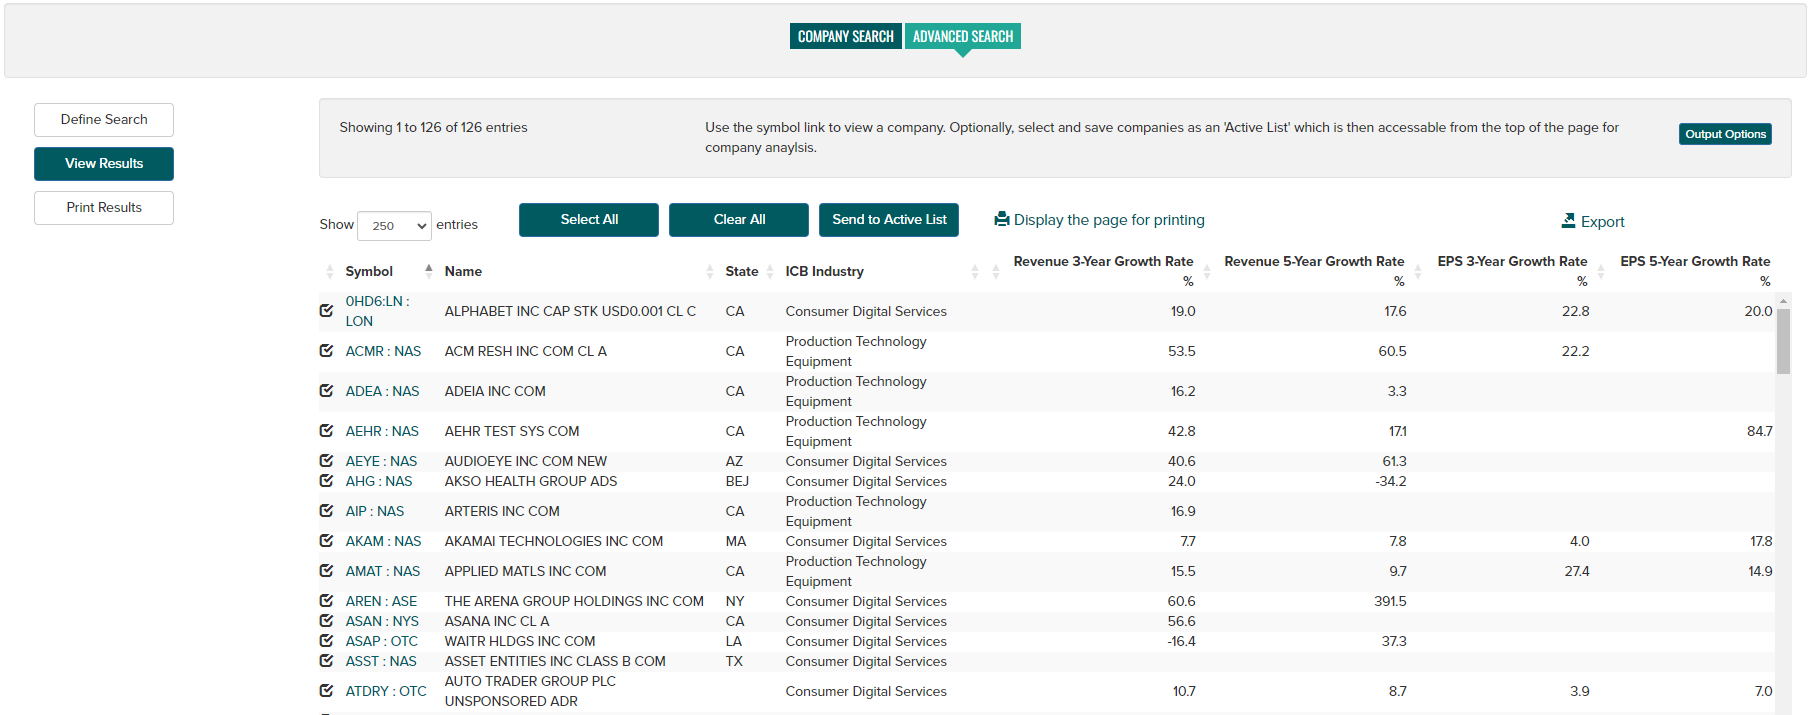
Use the Output Options button to add additional data items to the results view.
Use the Active List button at the top of the screen to save search results for future access. The Active List button can also be used to store a custom list of companies for easy access throughout your Market Atlas session.
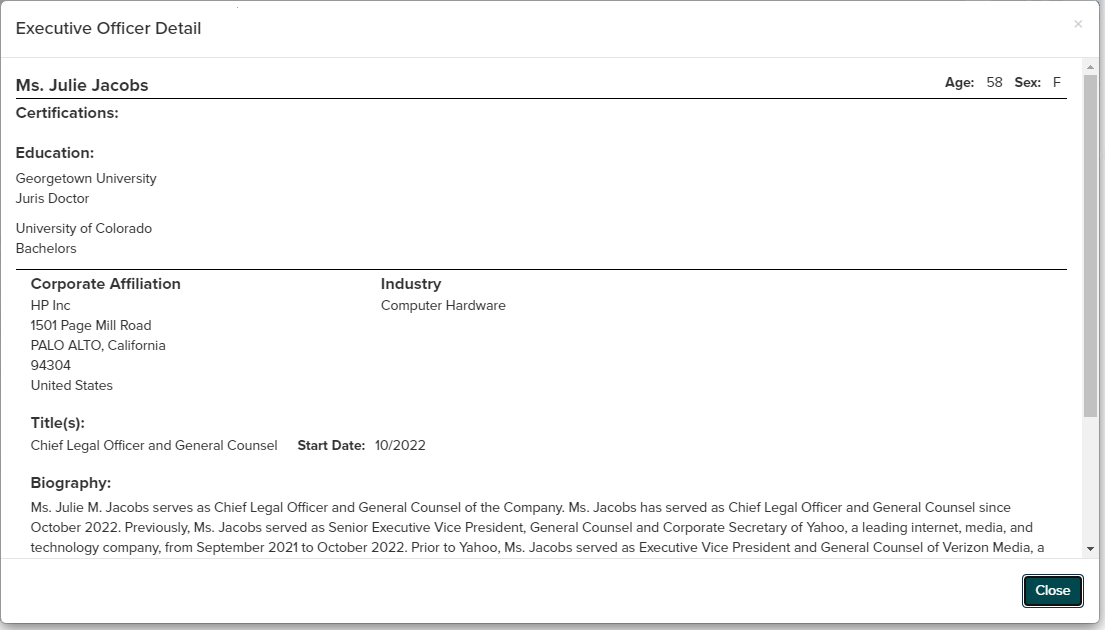
Executive Search - Search for executives based on name. Enter a Last Name and First Name (minimum first name initial), then click View Results.
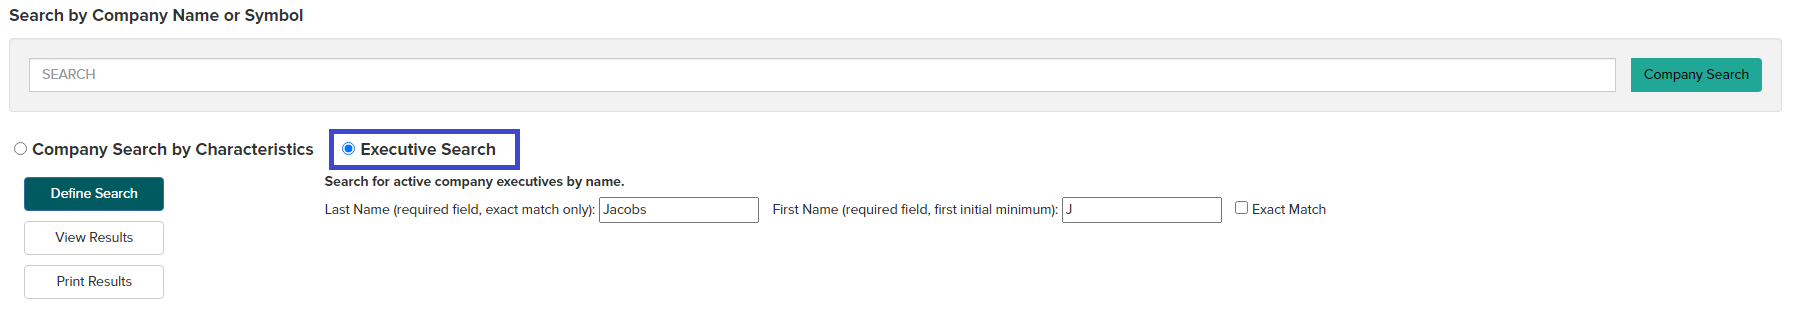
From search results page, click on an executive name to view Executive Officer Detail report.

Company
Overview
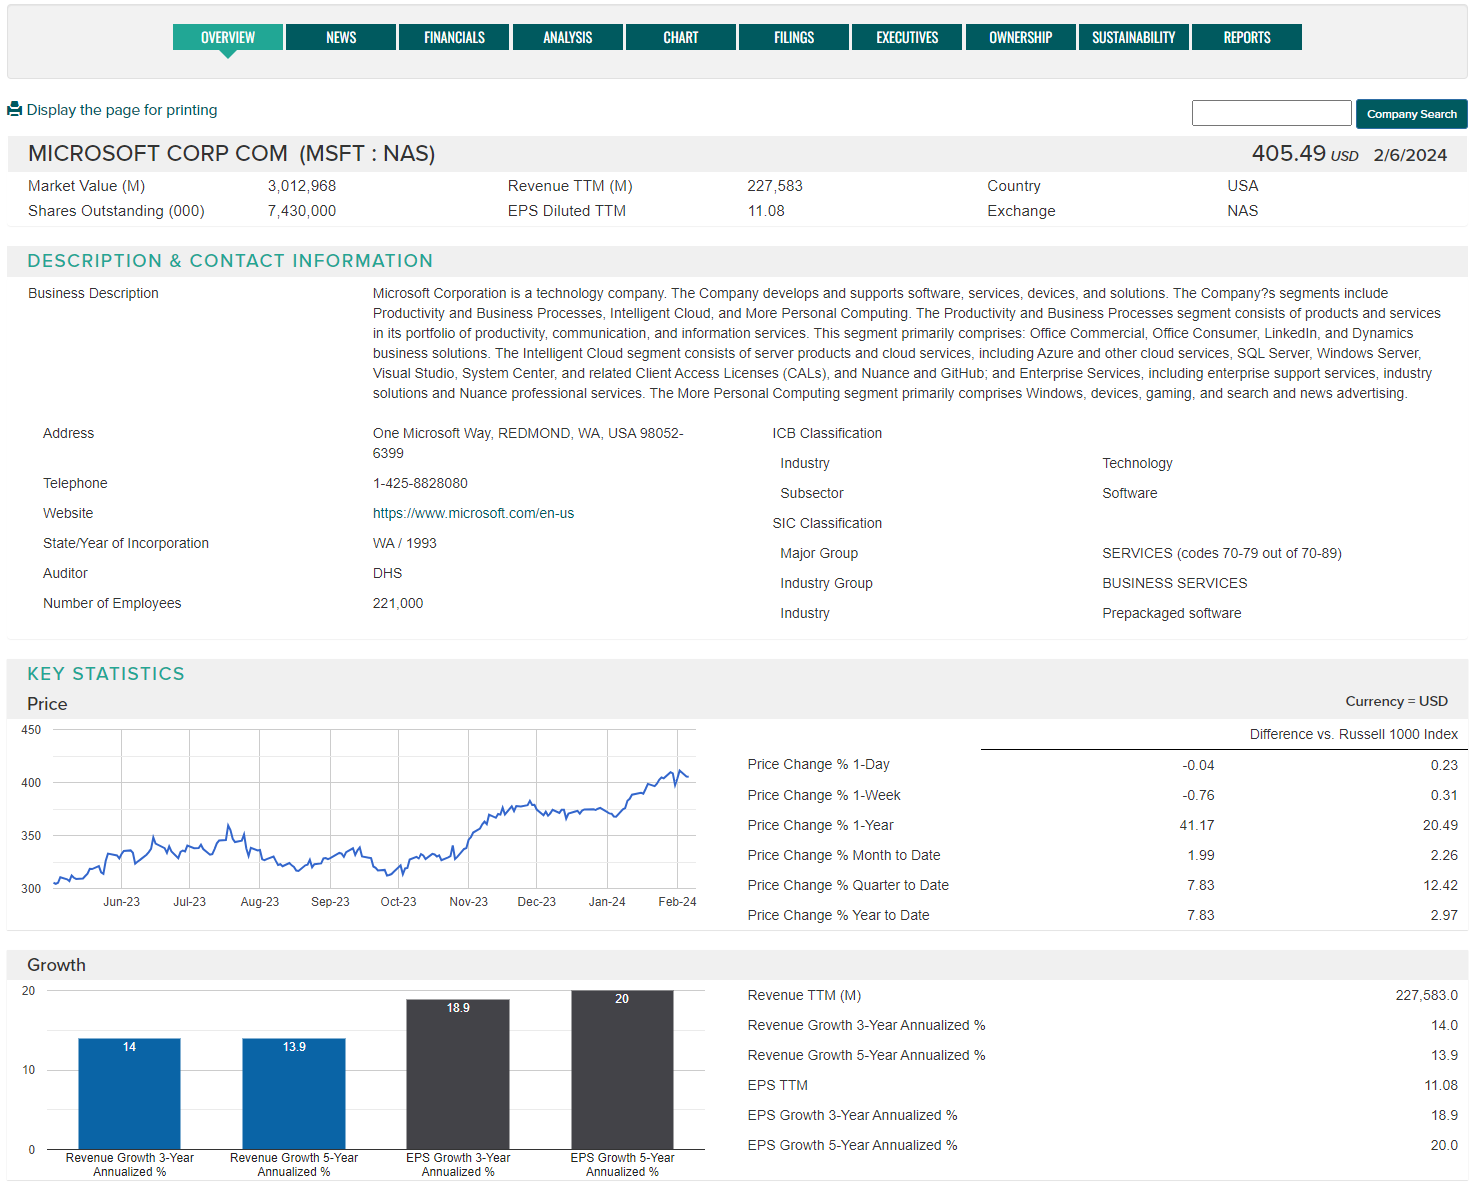
The Company Overview provides business description and contact details, ICB, SIC and NAICS business classification data along with key executive information. An adjustable price chart and price performance data along with key financials and ratios depicted through charts and tables. Use the "View Report" PDF icon to open a one-page summary company report. Use the star next to the company name to save to your active list.
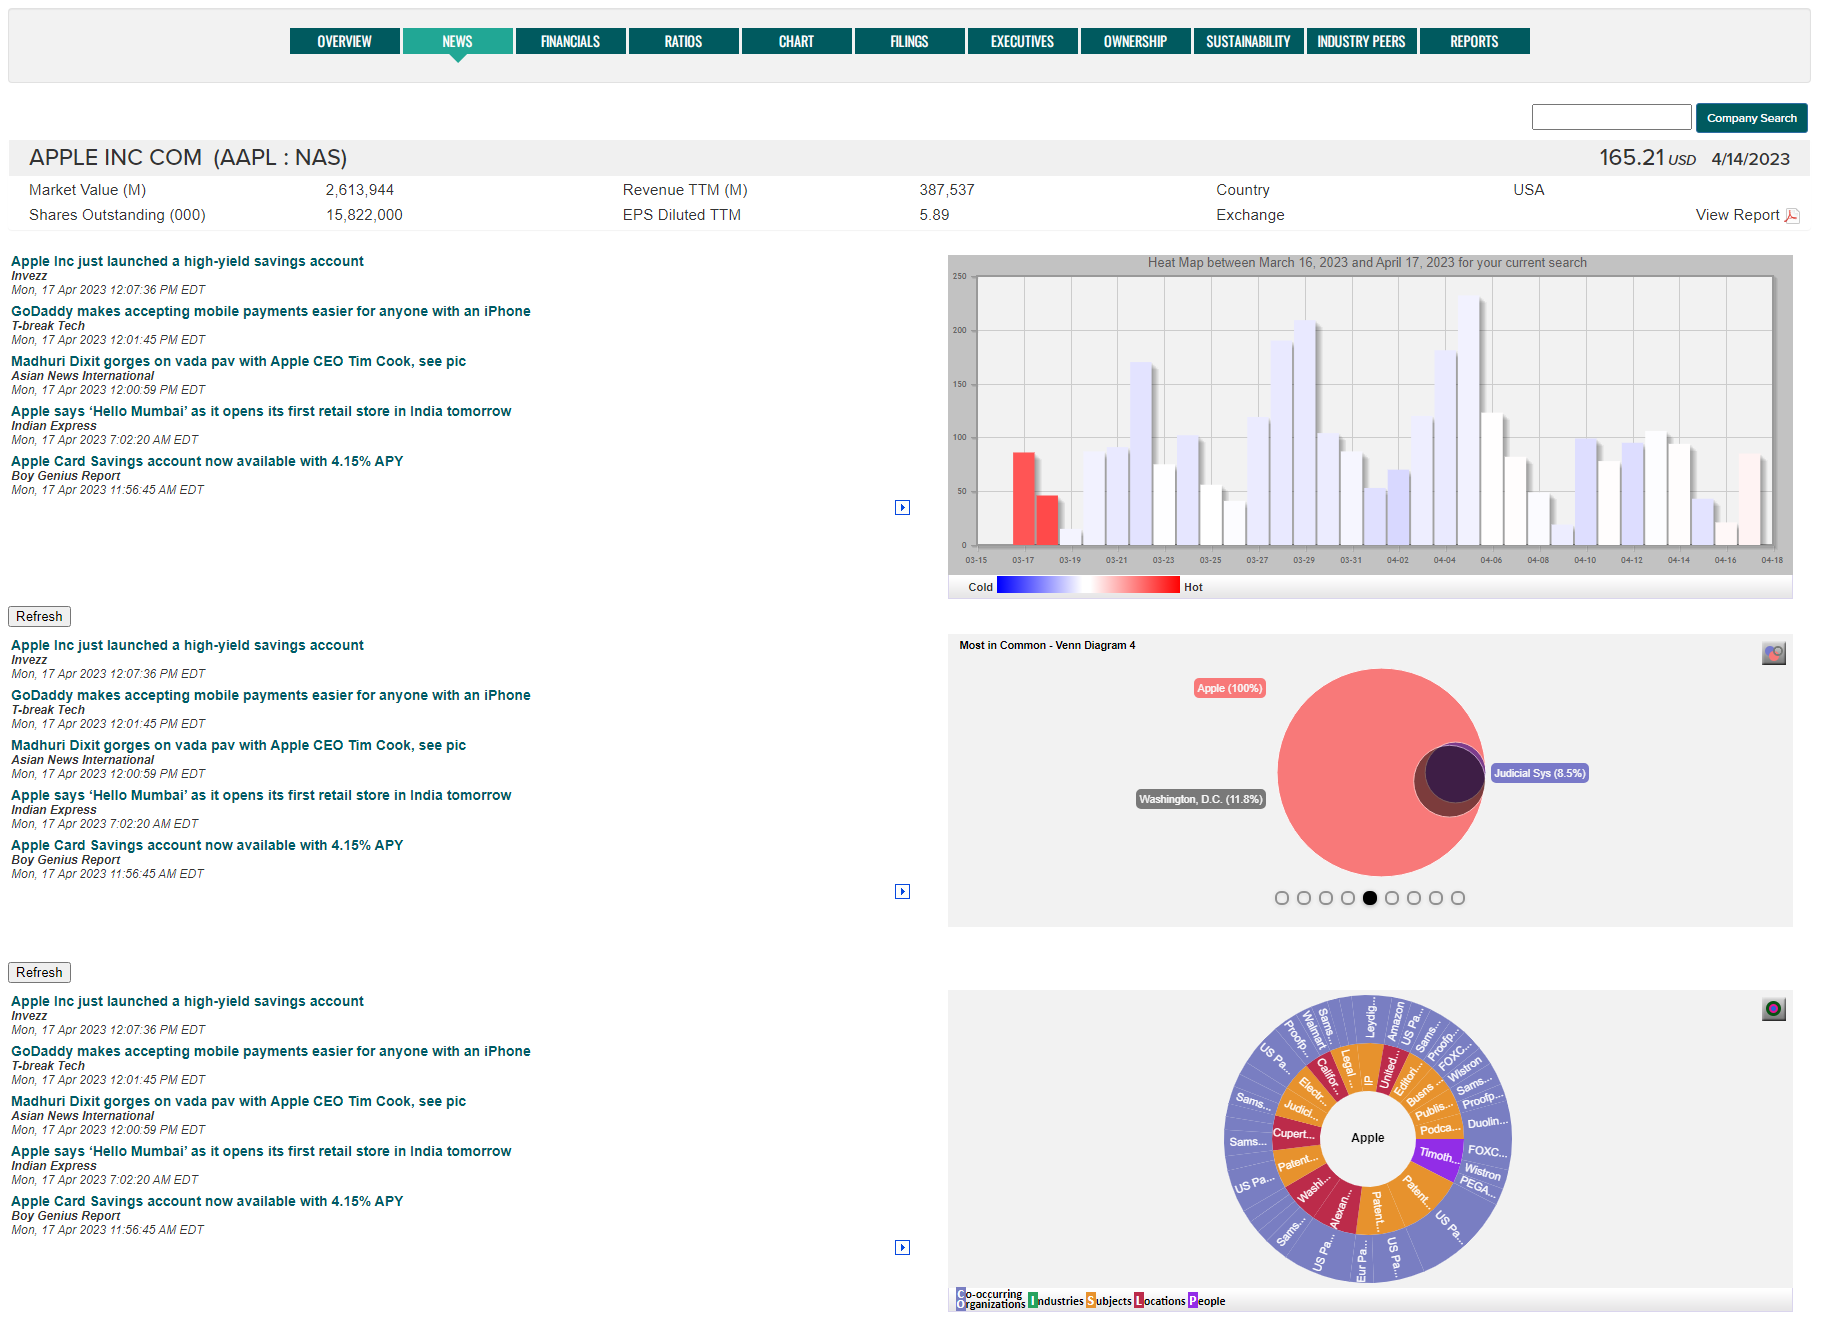
News
At the company-level view, users can access multiple interactive news widgets as well as the most recent news articles related to Management Change and Market Drivers. More information on these news widgets can be found in the Naviga News Widget Help Guide (PDF)
Financials
Provides access to both Standardized and As Reported financial statements along with Ratio Series data.
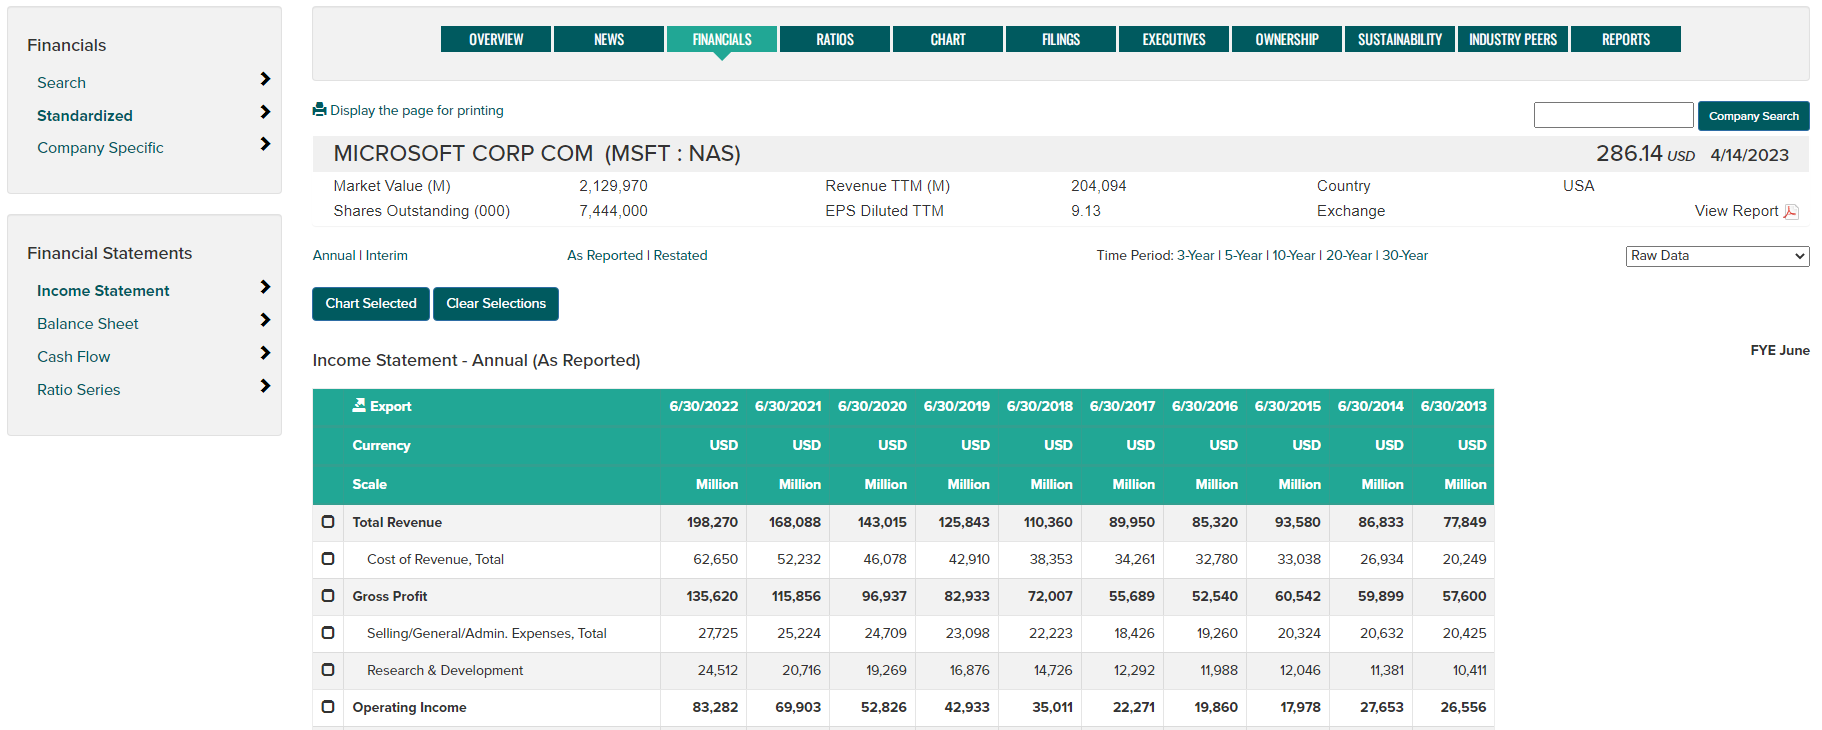
Display options and additional features include:
- Standardized financials - presented in standard account format across Industrial, Bank and Insurance industry types.
- Company Specific financials - presented using the format and account structure as reported by the company.
- Financial Statements - use the left navigation controls to view Income Statement, Balance Sheet, Cash Flow, All Financials, Ratio series or All (displays all Standardized financials pages together).
- Time Periods - select from 3, 5, 10, 20, 30 and Max (maximum) year time periods.
- As Originally Reported/Restated - choose to view originally reported or restated financials.
- Annual/Interim - choose desired reporting frequency.
- Export to CSV - use the Export button to produce a CSV file.
- Display page for printing - format the page contents for printing.
- Currency - view Standardized financials in an alternate currency transformation. The exchange rates used for translation are month end rates for the reporting period shown.
- Scaling - view Standardized financials in the scale of Thousands, Millions or Billions.
- Data transforms - use the dropdown on the right side of the page to select Raw Data, % Change, Raw Data and % Change, Common Size or Raw Data and Common Size format.
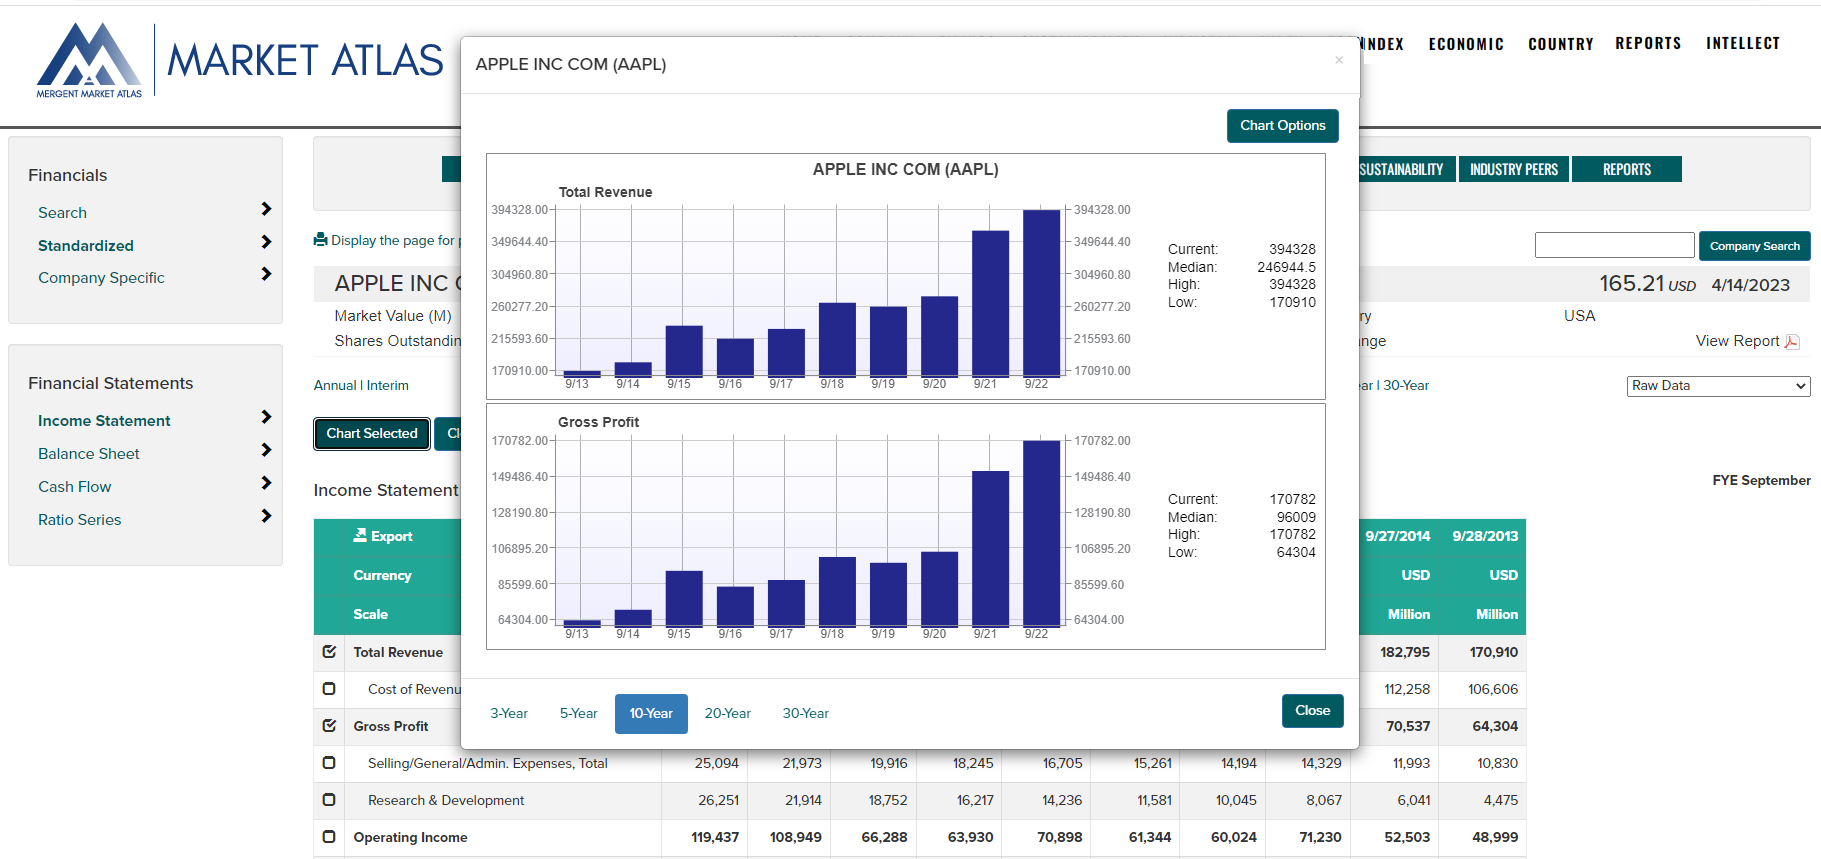
- Chart - use the account check boxes follwed by the Chart Selected button. The resulting chart offers options to print or save to PDF using the Chart Options button.
Analysis
-
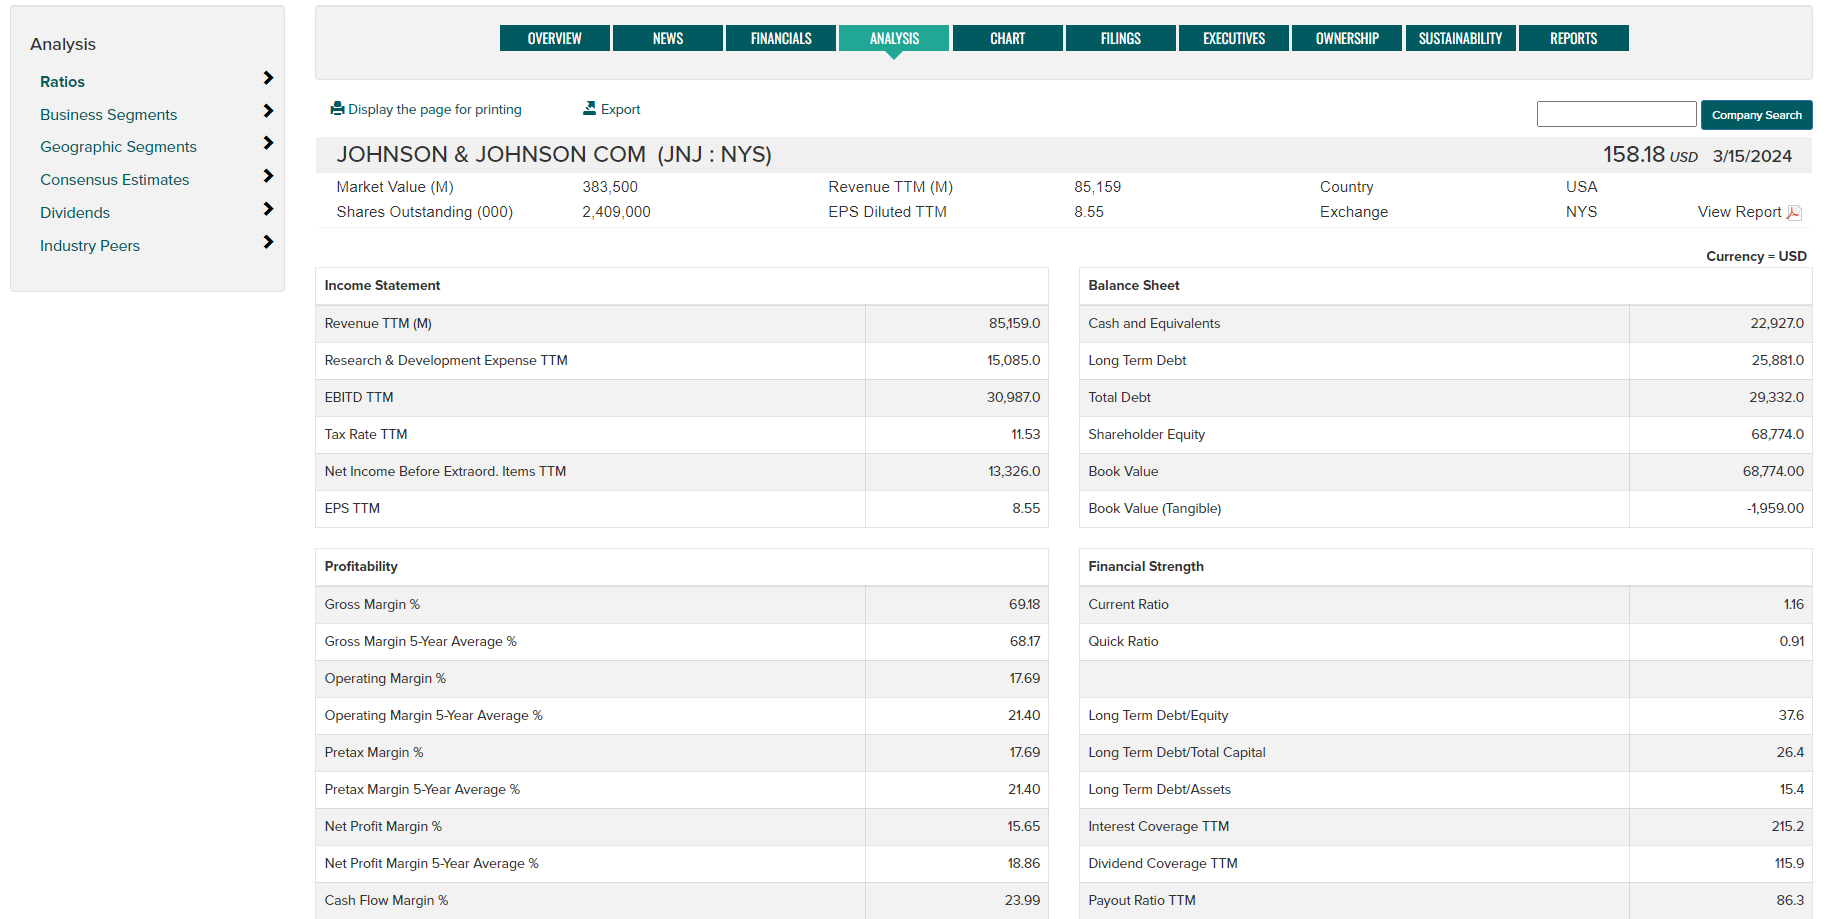
Ratios - Current point in time ratios covering:
- Profitability
- Financial Strength
- Management Effectiveness
- Efficiency
- Growth rates
- Valuation
Note: Select ratio series are also available from the Financial Statements/Ratios menu.
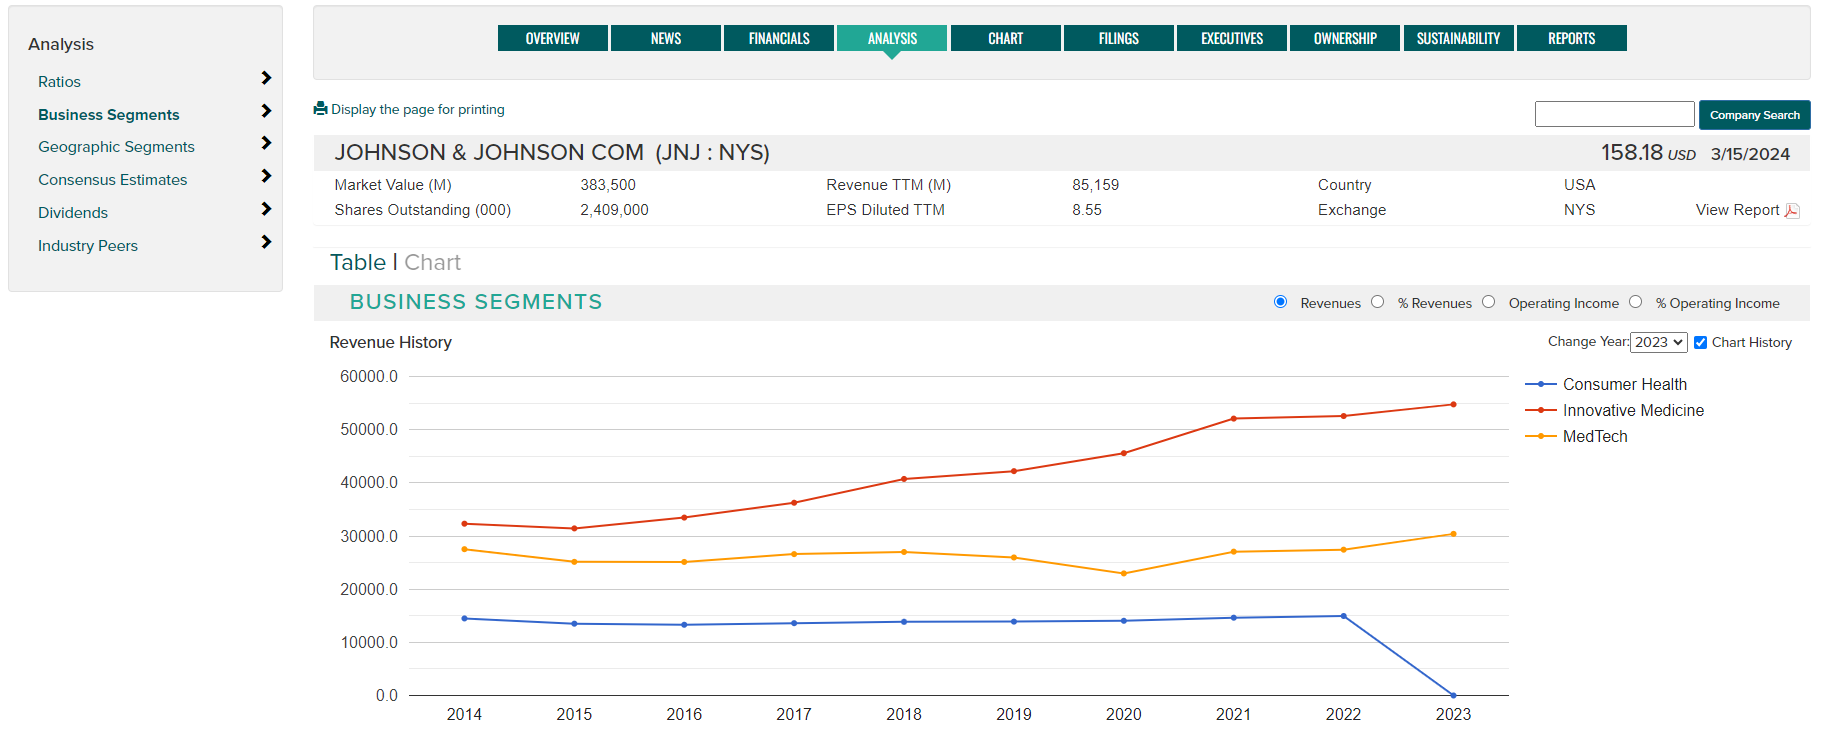
- Business and Geographic Segments - Toggle between textual and chart displays showing business and geographic segment data. Data options include Revenues and Operating Income.
-
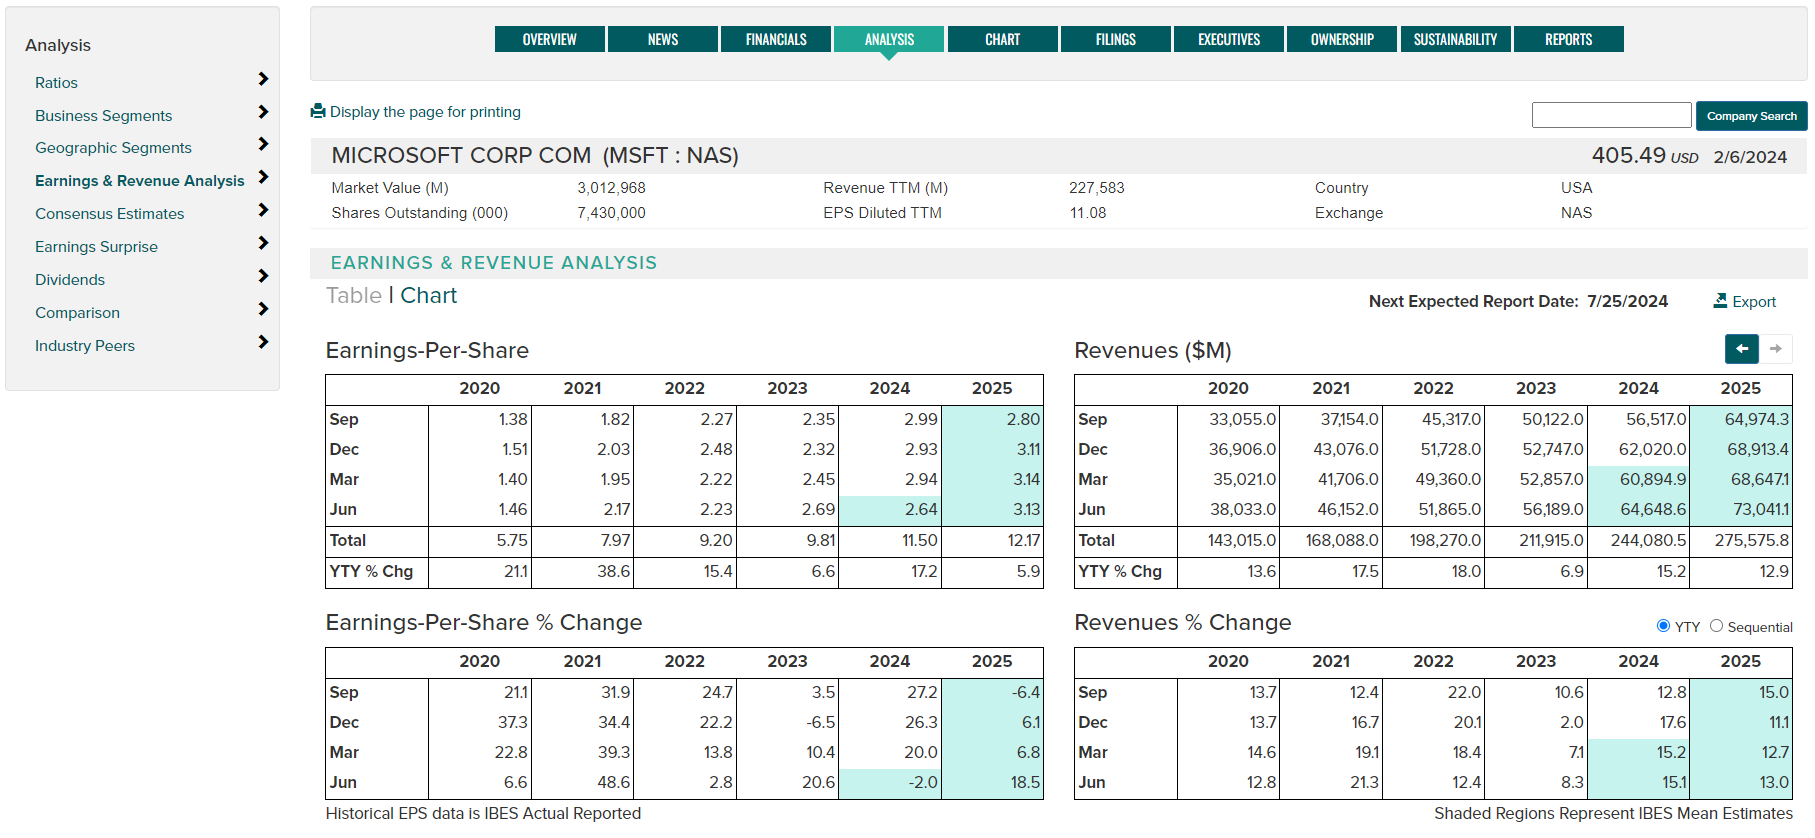
Earnings & Revenue Analysis - View historical quaterly EPS and Revenue data along with consensus estimates (shaded) for upcoming quarters. Raw data is presented along with historical and implied year over year or sequential growth rates for both EPS and Revenues.
- Use the arrow scroll button to see additional historical data.
- Use the YTY (year to year) and Sequential toggle to change the growth rate calculation.
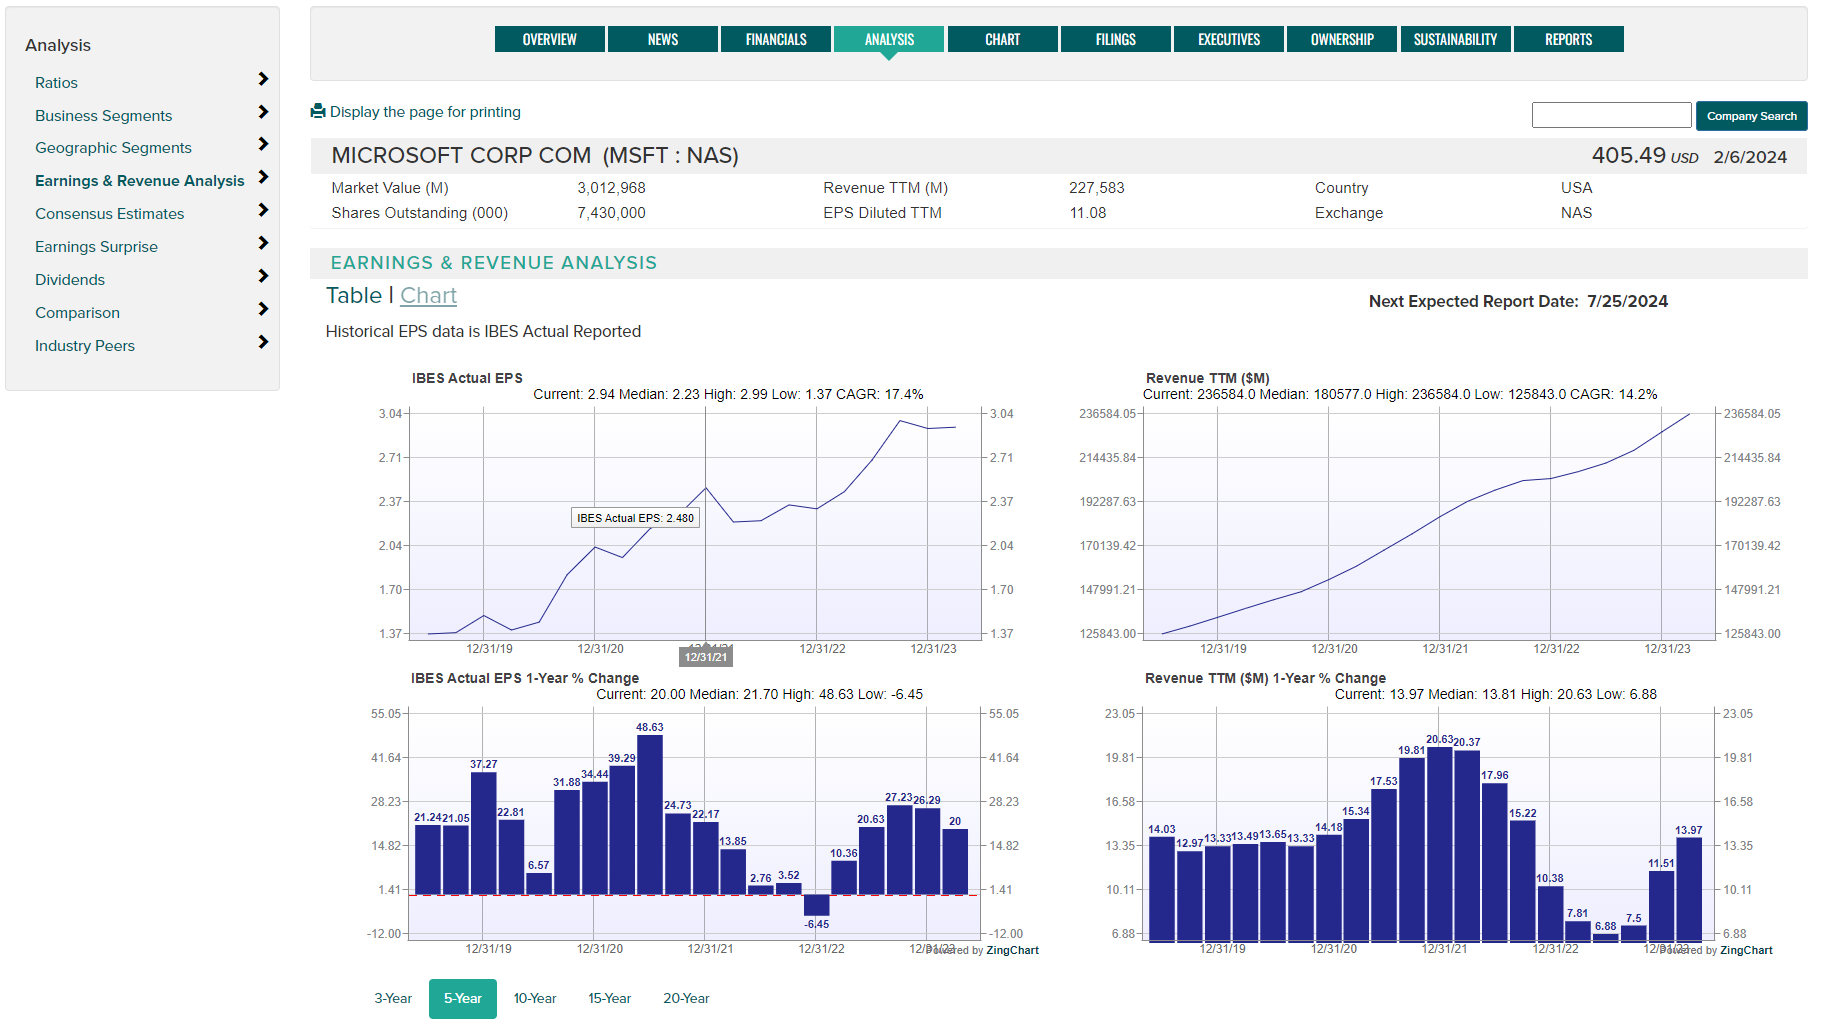
- Use the Chart toggle to view 3, 5, 10, or 15 year graphs of EPS and Revenues.
- Export data to an Excel file using the Export button.
- Chart Format:
-
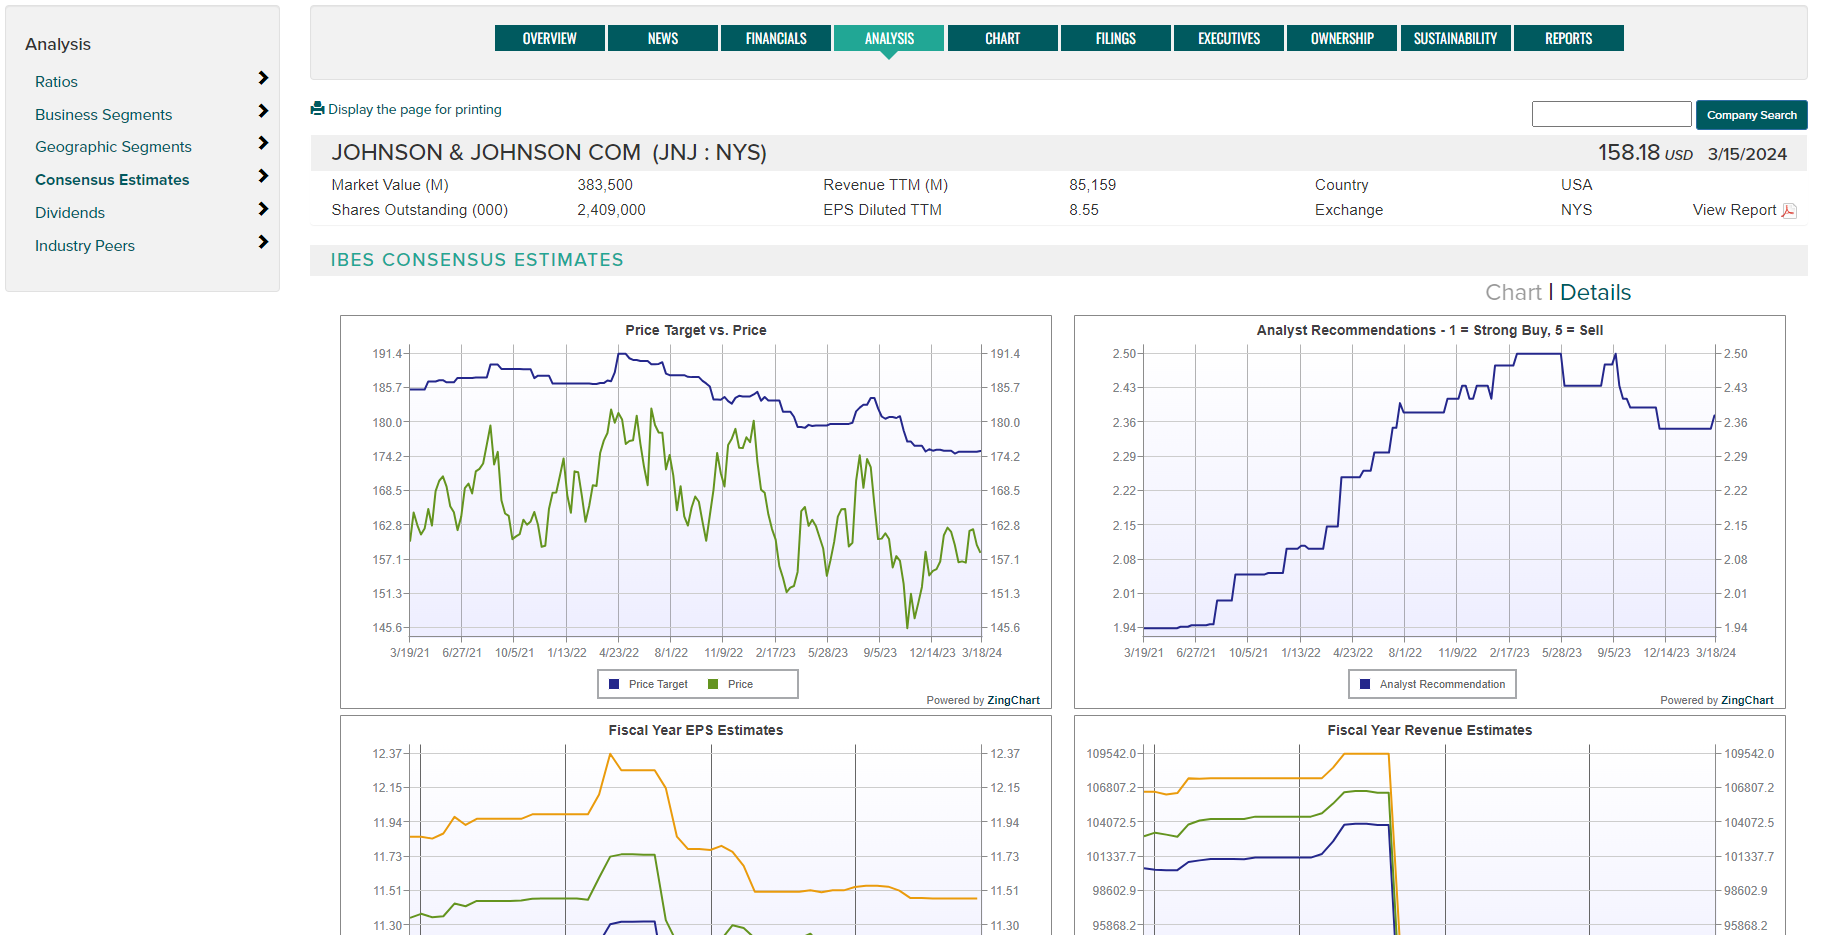
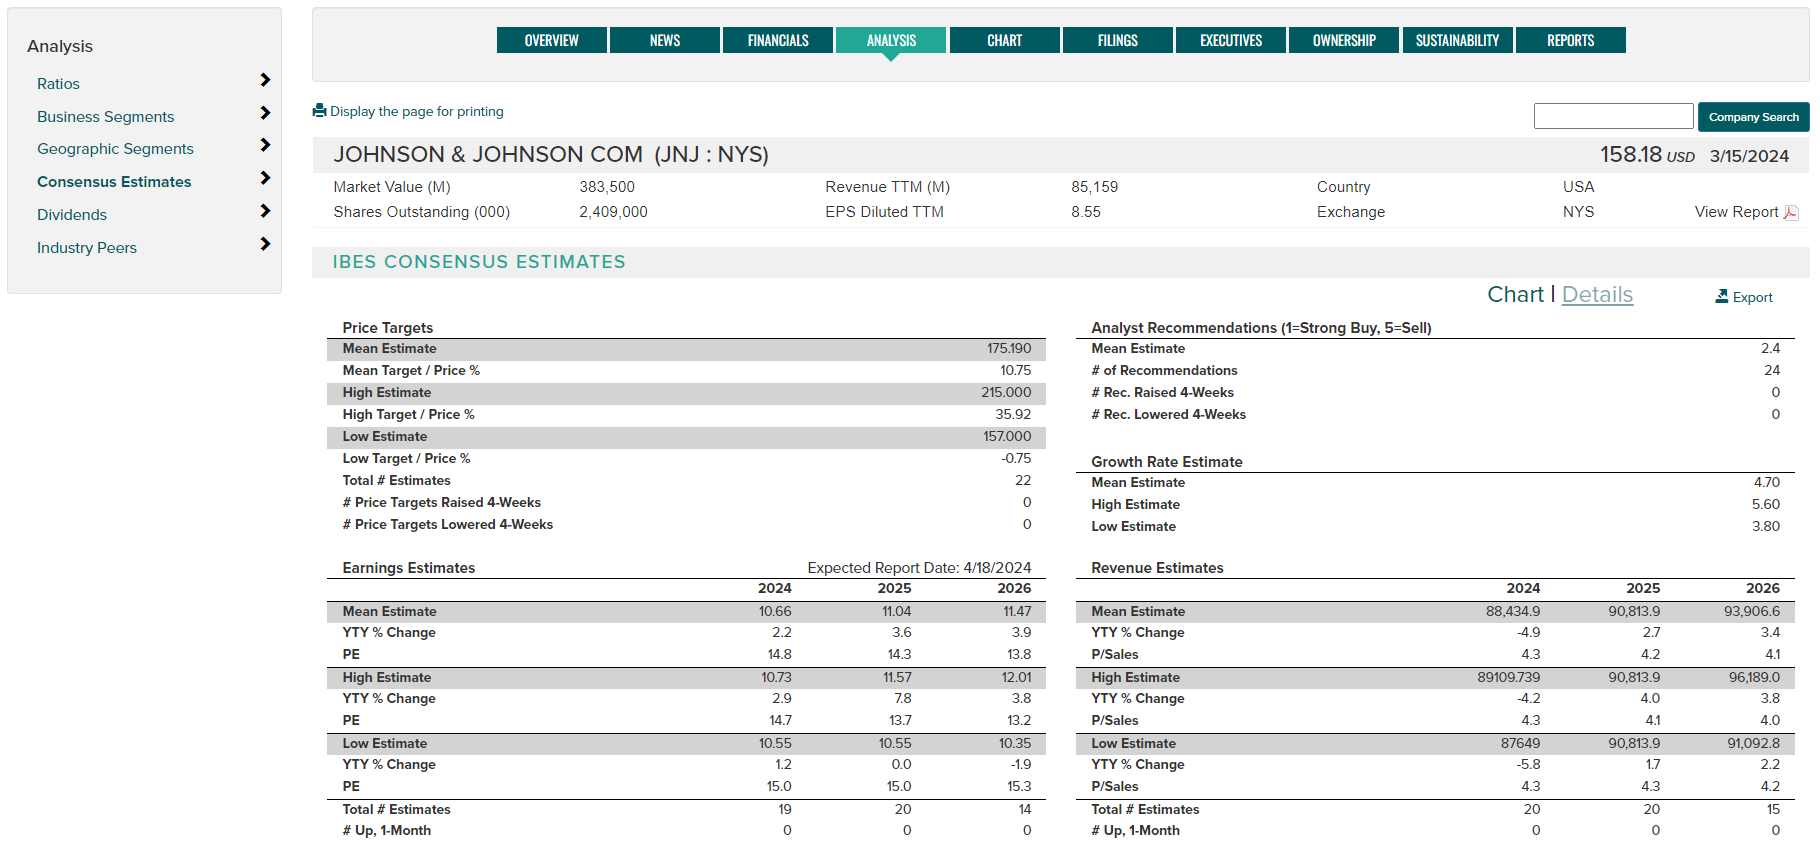
Consensus Estimates - Current point and historical trends in annual and interim consensus estimate data covering:
- Price targets
- Analyst recommendation ratings
- Growth rate estimate
- Earnings estimates
- EBITDA estimates
- Cash Flow Per-Share estimates
Use the Chart/Details toggle to view chart or tabular data.
-
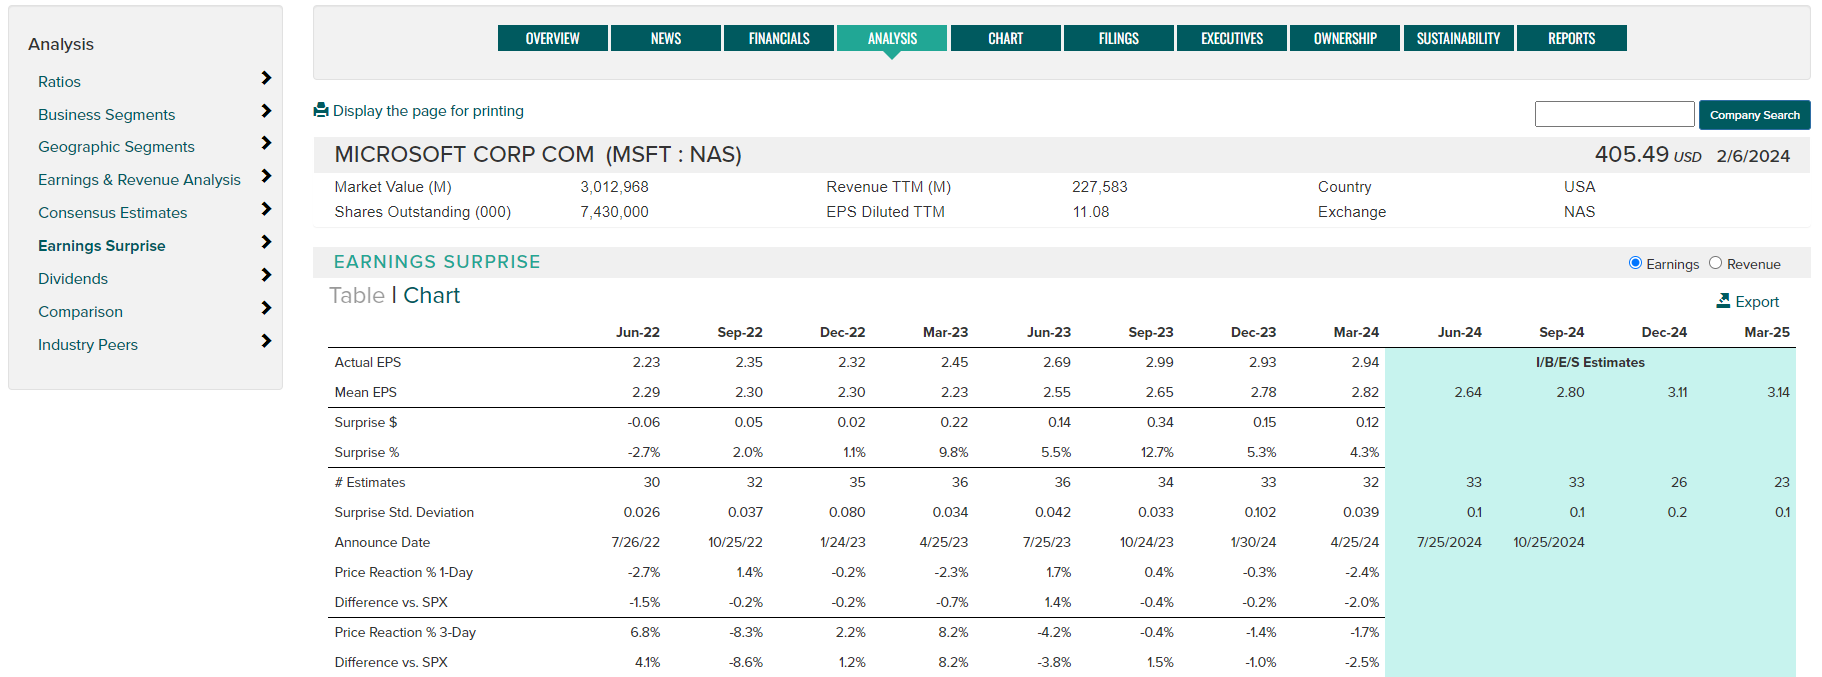
Earnings Surprise - View the last 8 quarters earnings and revenue surprise data for a company, including surprise in $ and percentage. Additional data for each quarter includes earnings announce date, along with price reaction 1-day and 3-day (including difference from the SP500 Index for each period).
- Toggle data type using the Earnings and Revenue toggle buttons.
- Use the Chart toggle to view surprise data in the form of a chart.
- Export data to an Excel file using the Export button.
- Chart Format:

-
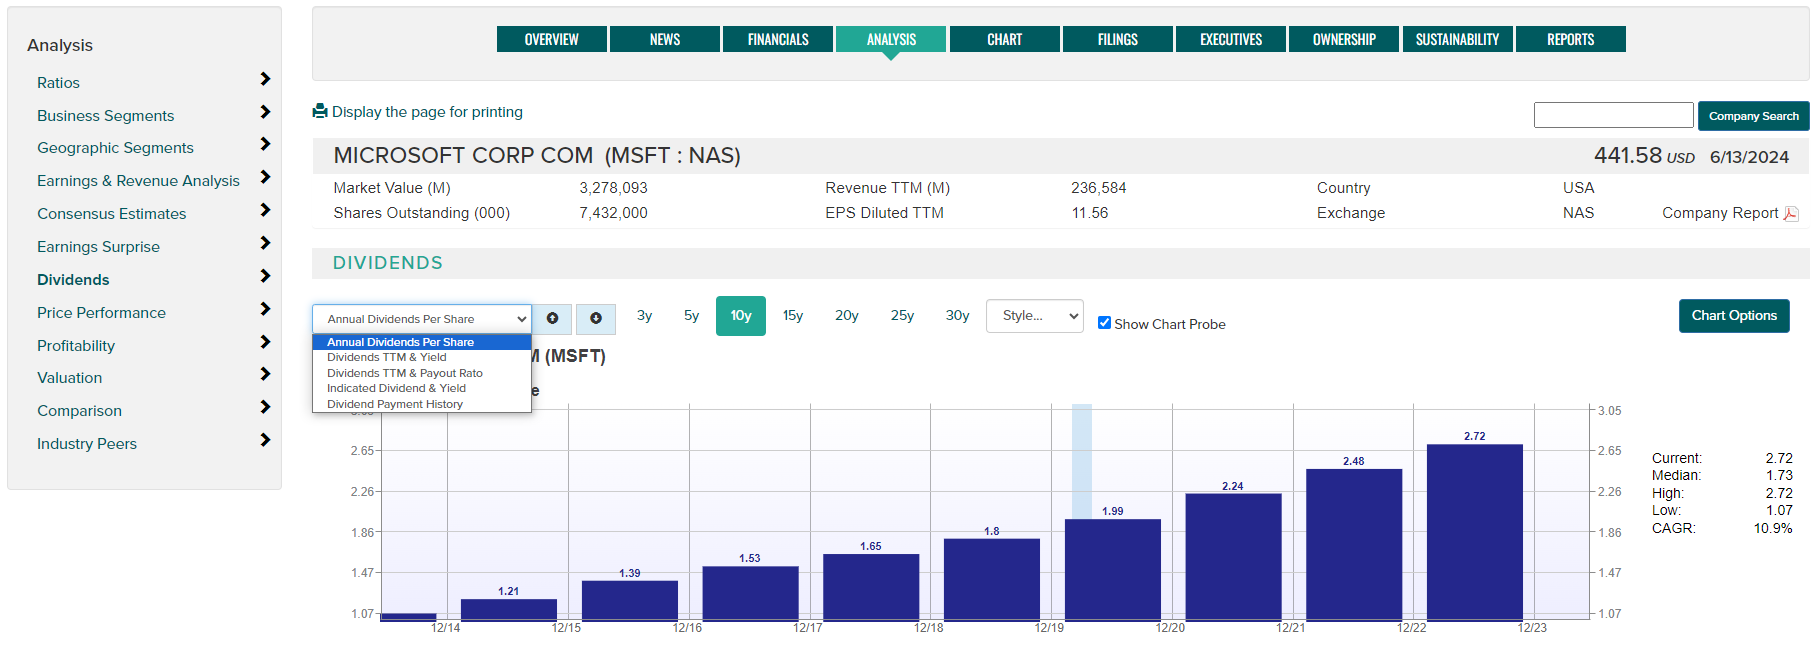
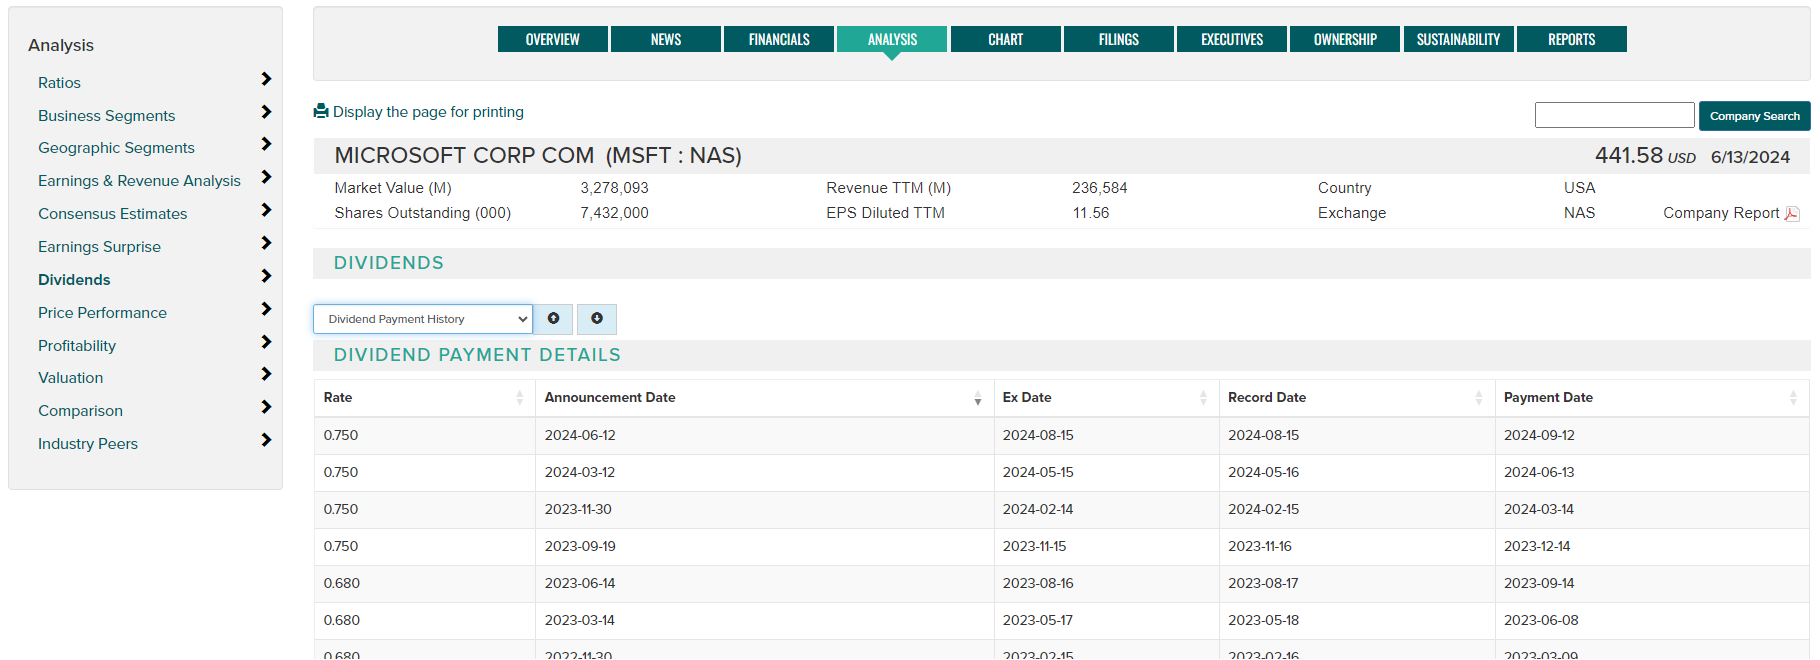
Dividends - The Dividends page offers several interactive charts and a table showing historical dividend details. Use the dropdown to choose from:
- Annual dividends chart with variable time periods and statistics
- Dividends TTM (trailing 12 months) and associated Dividend Yield
- Indicated Dividend and associated Yield
- Dividend payment detail table (Rate, Annouce Date, Ex-date, Record date, Payment date)
-
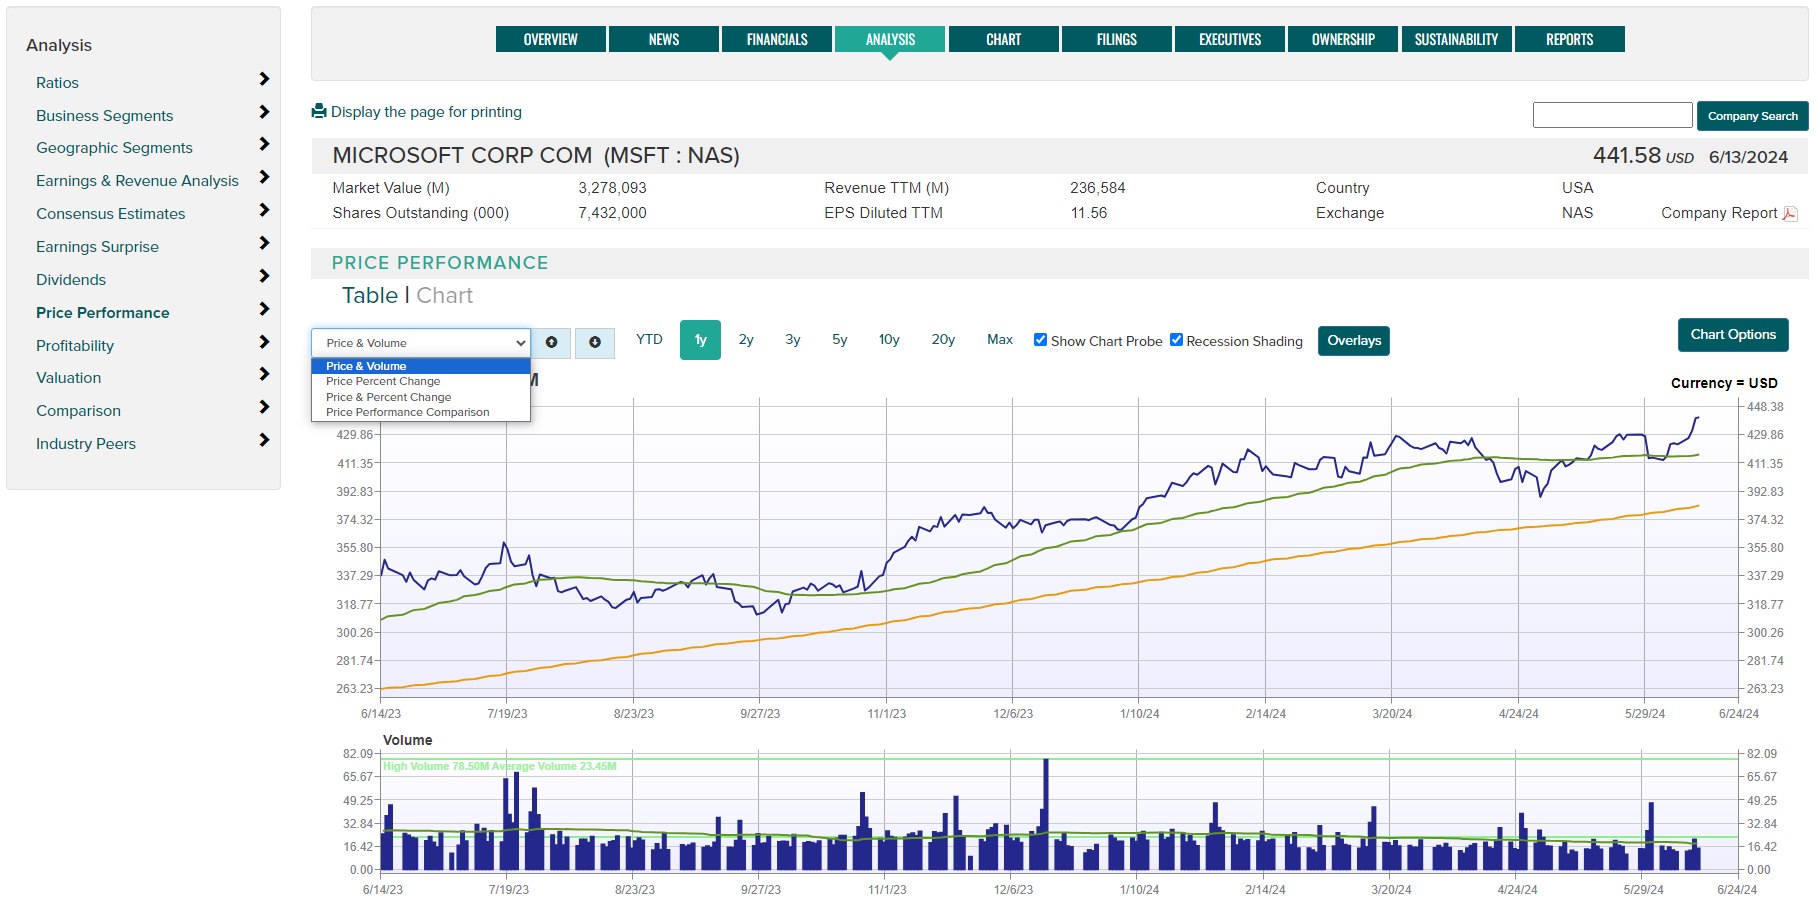
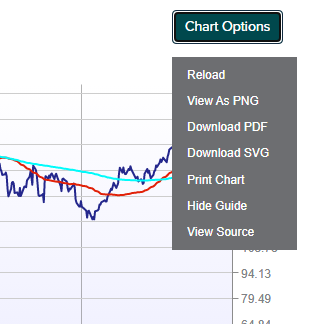
Price Performance - The Price Performance page offers serveral interactive charts depicting individual and comparative price performance data and statistics. Chart Probe and Recession Shading can be optionally shown. Use the Chart Options button to save to print or save the image to a file. Use the dropdown to select from the following chart options:
- Price & Volume - daily price and volume history available for variable time periods, use the Overlays button to add various moving averages to the price series.
- Price Percent Change - Charts percentage change from a given start point.
- Price & Percent Change - Two charts showing raw price data and percent change data.
- Price Performance Comparison - View up to ten securities price performance on the same chart.

-
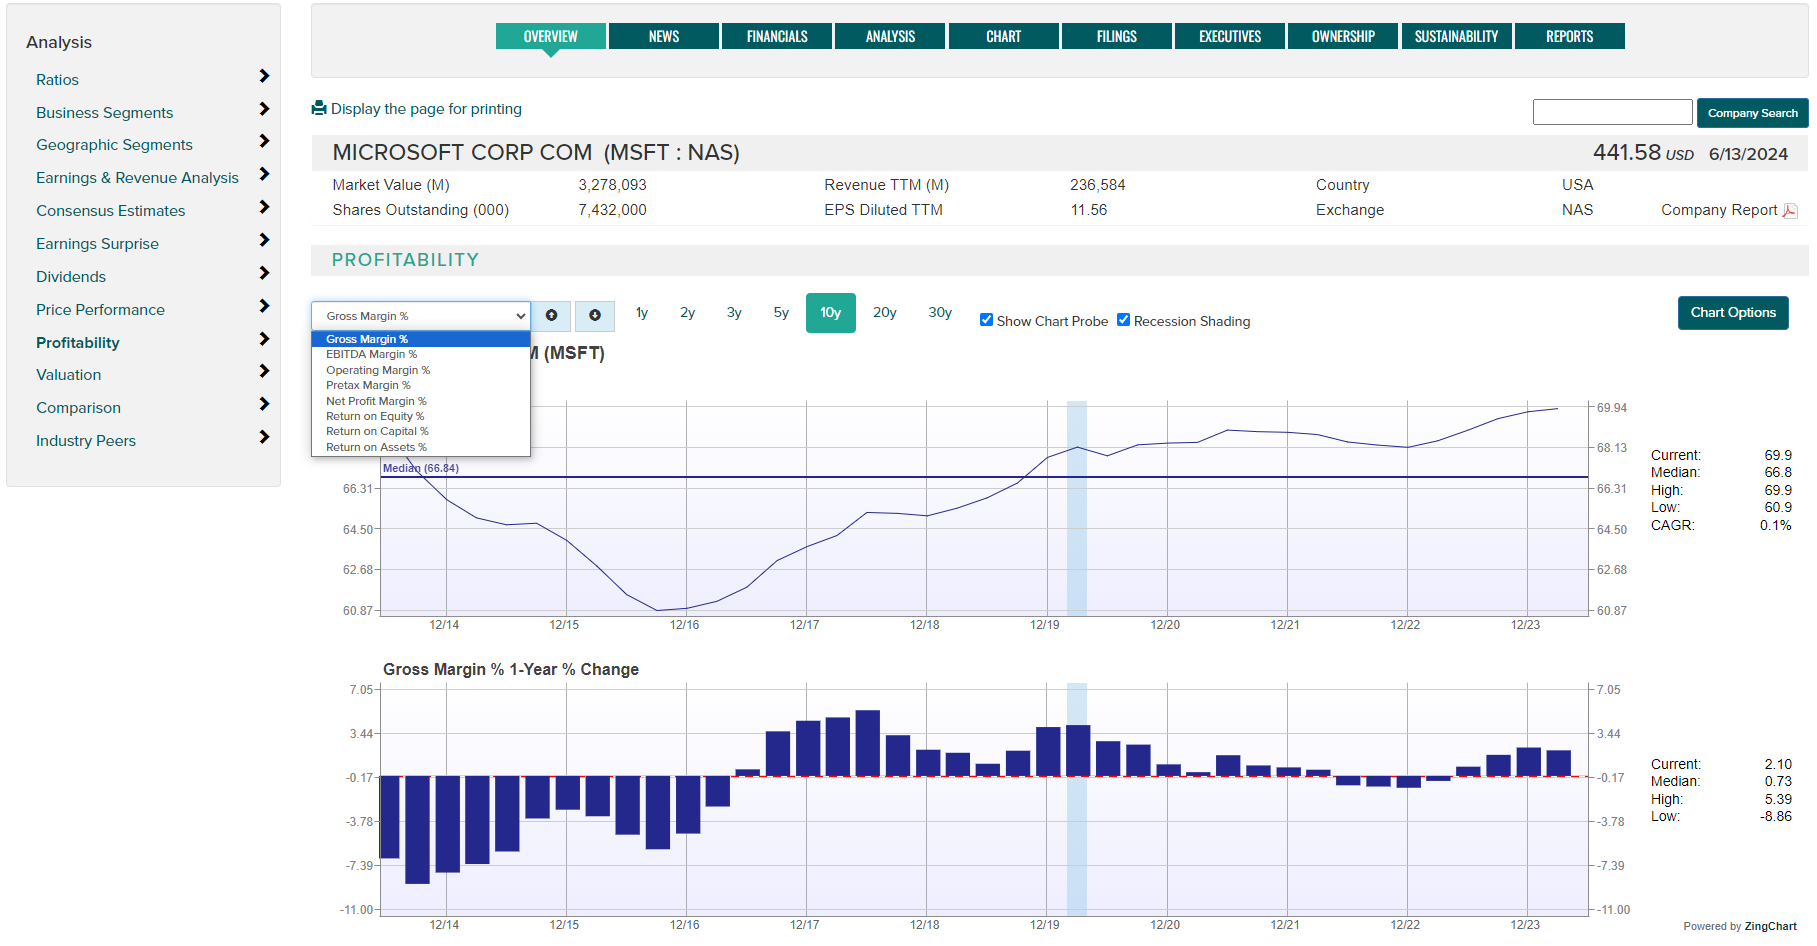
Profitability - The Profitability page offers several interactive profit margin and return data charts over variable time periods, along with relevent statistics. Chart Probe and Recession Shading can optionally be shown. Use the Chart Options button to save to print or save the image to a file. Use the dropdown to select from the following chart options:
- Gross Margin %
- EBITDA Margin %
- Operating Margin %
- Pretax Margin %
- Net Profit Margin %
- Return on Equity %
- Return on Capital %
-
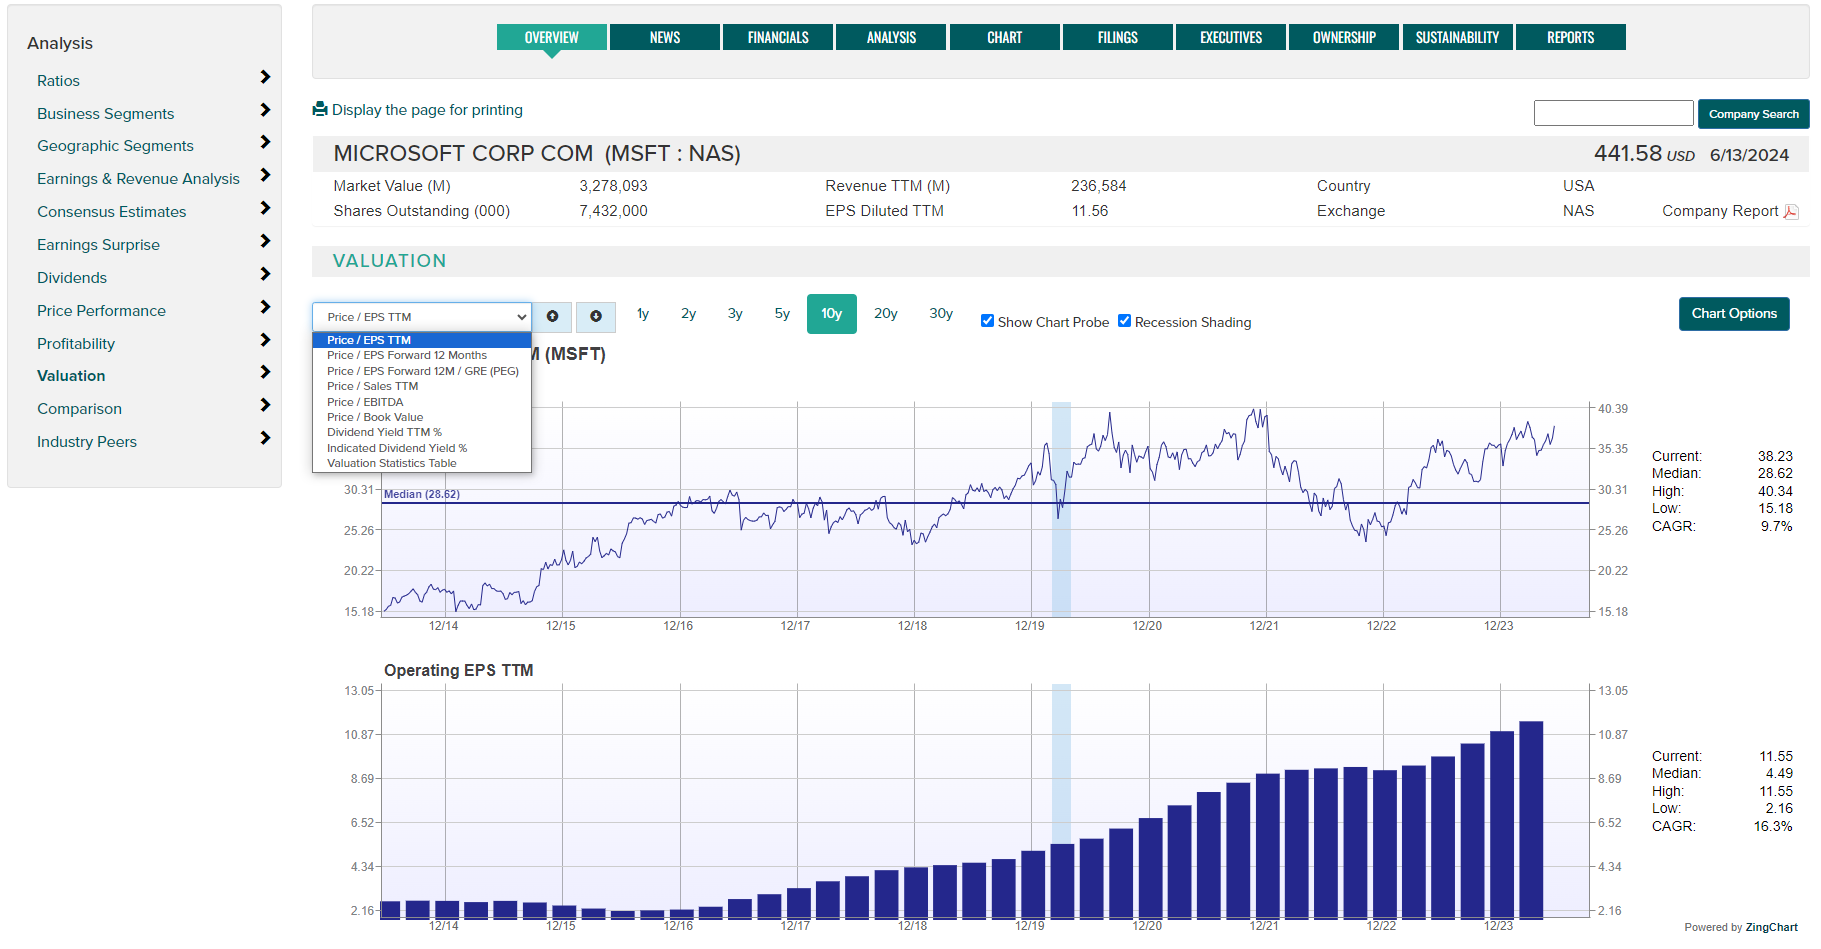
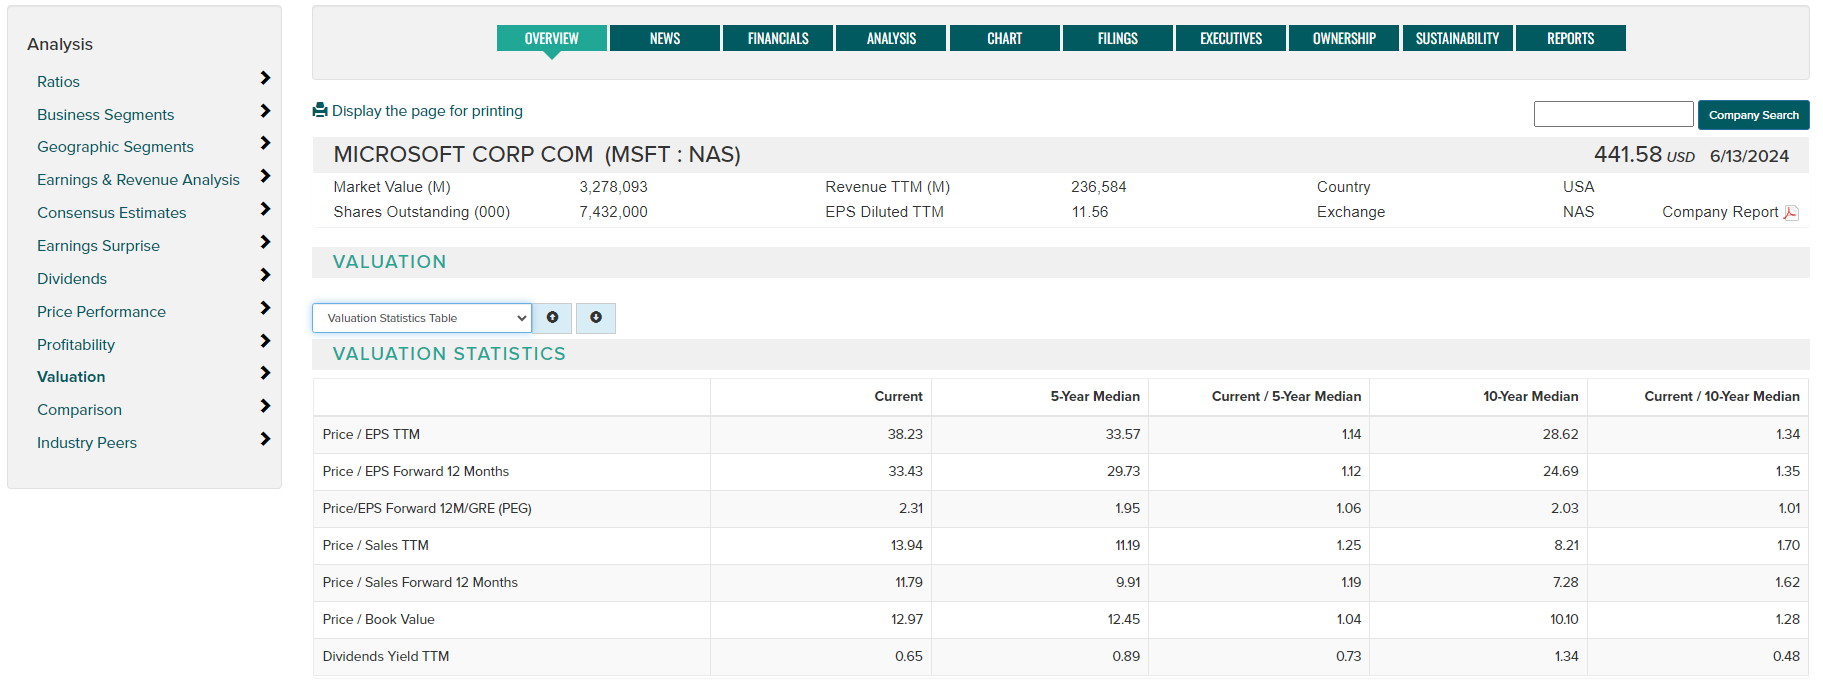
Valuation - The Valuation page offers several interactive charts over variable time periods, along with a Valuation Statistics table. Chart Probe and Recession Shading can be optionally shown. Use the Chart Options button to save to print or save the image to a file. Use the dropdown to select from the following chart and table options:
- Price / EPS TTM (trailing 12 months)
- Price / EPS Forward 12 Months
- Price / EPS Forward 12 Months / GRE (growth rate estimate)
- Price / Sales TTM (trailing 12 months)
- Price / EBITDA (earnings before interest, taxes, depreciation and amortization
- Price / Book Value
- Dividend Yield TTM (trailing 12 months)
- Indicated Dividend Yield
- Valuation Statistics Table
-
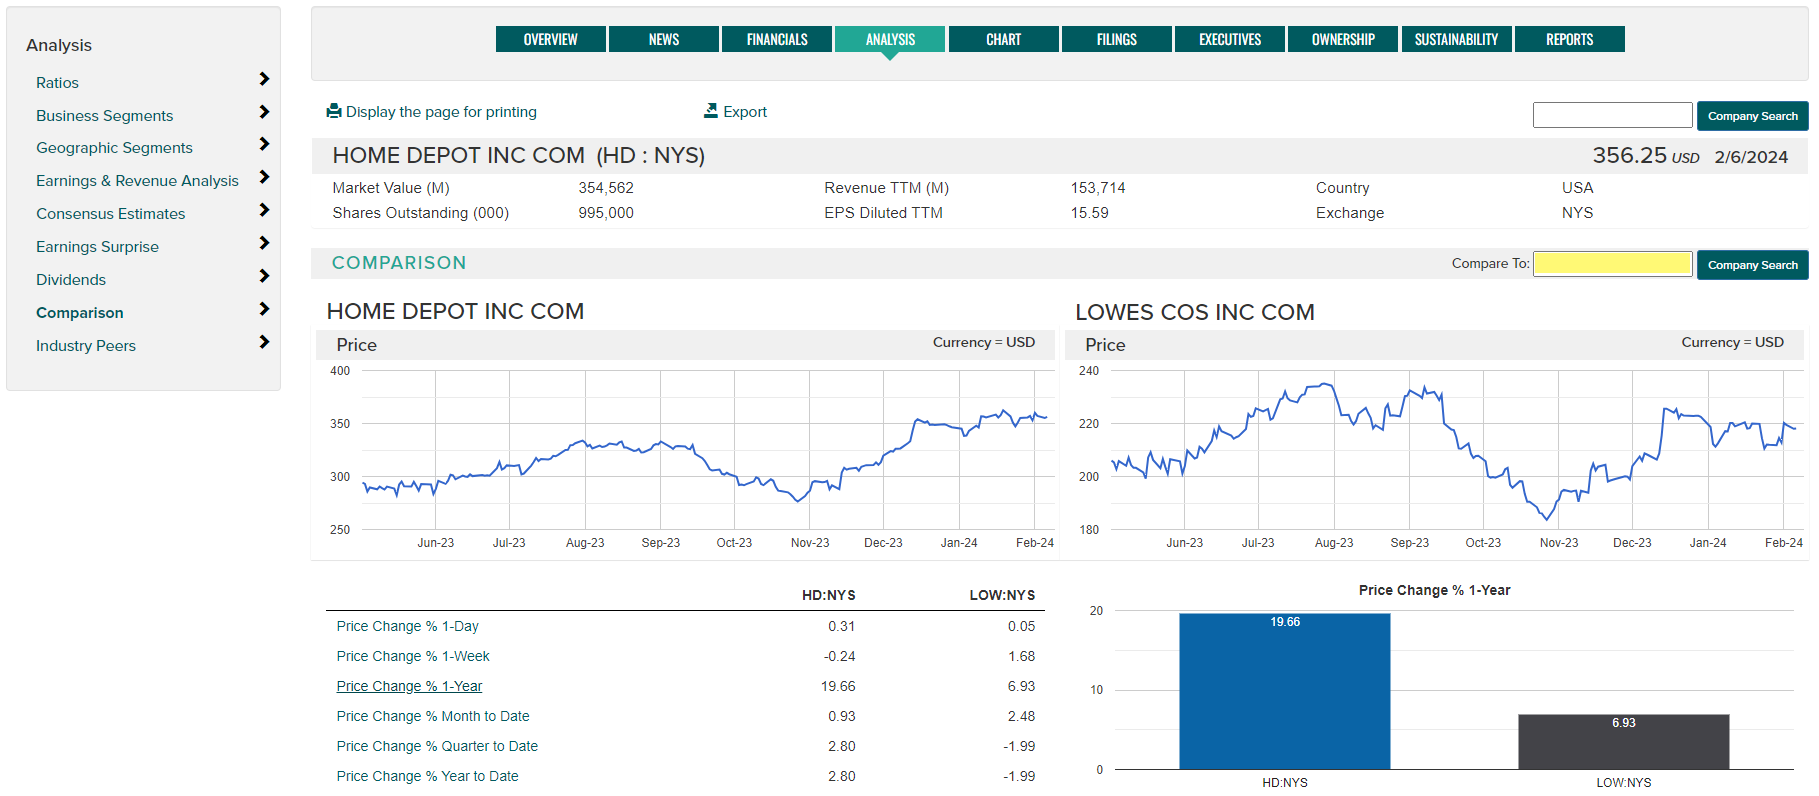
Comparison - Compare two companies side by side examining raw financial data, financial ratios, business classification and descriptions. Note that some company data may be displayed in different currencies.
- Use the 'Compare To' option (highlighted below) to enter or change a comparison company.
- Click on data item titles to change the comparison chart shown to the right.
- Export data to an Excel file using the Export button.
-
Industry Peers - View a company's financial ratio data alongside its ICB, SIC or NAICS industry peers in multiple report formats.
- Profitability
- Management Effectiveness
- Efficiency
- Financial Strength
- Growth Rates
- Valuation
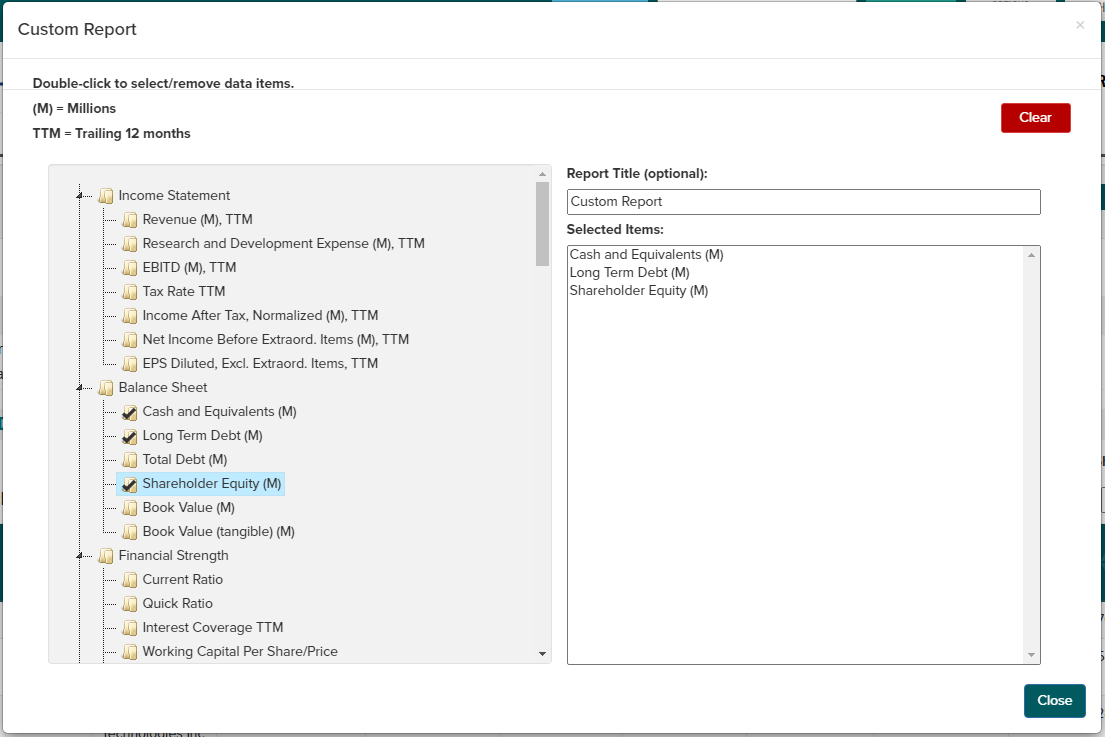
- Custom Report (create your own report based on available data items)
Use the Peer Group dropdown to select a classification system or your own Active List.
Use the Country of Incorporation dropdown to view industry comparables from a single country or globally with 'All Countries'.
Choose to view top 10, top 20 (based on market capitalization) or all peers.
Remove peer companies from the report using the 'X' next to the symbol.
Add peer companies using the 'Add Company' option.
Use the Export button to create a CSV file for further analysis.
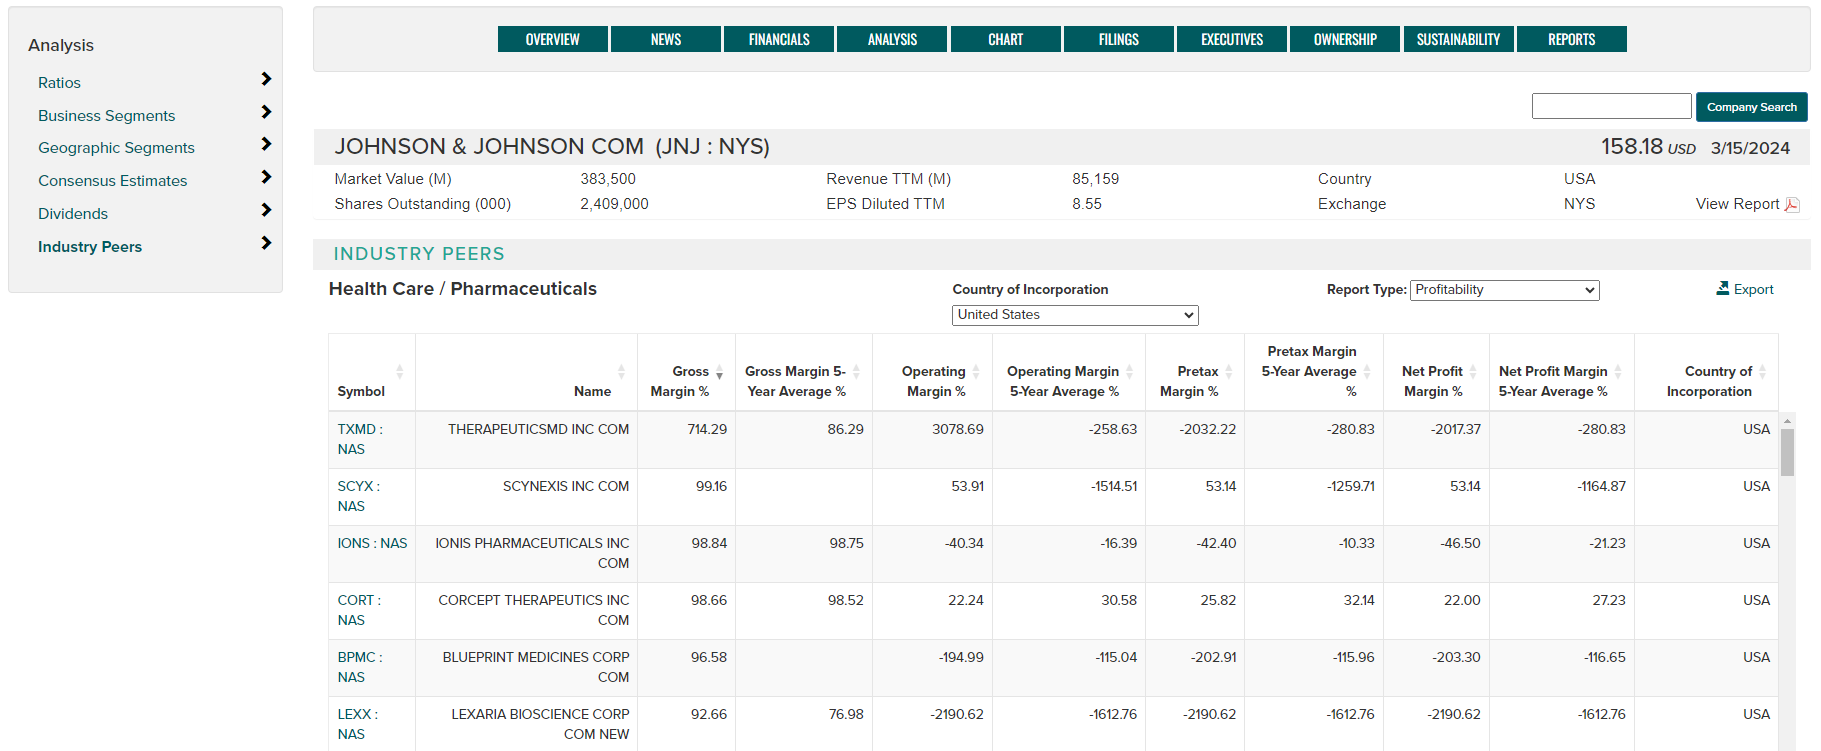
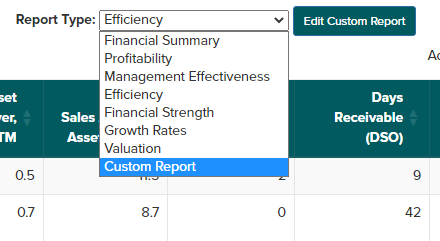
Use the Report Type dropdown to choose from a variety of preformatted reports or choose Custom Report to select your own data items.
Double click on data items to select for inclusion in your custom report. Provide a report name (optional) and select Close when complete.
Chart
View company charts covering price, technical analysis and fundamentals.
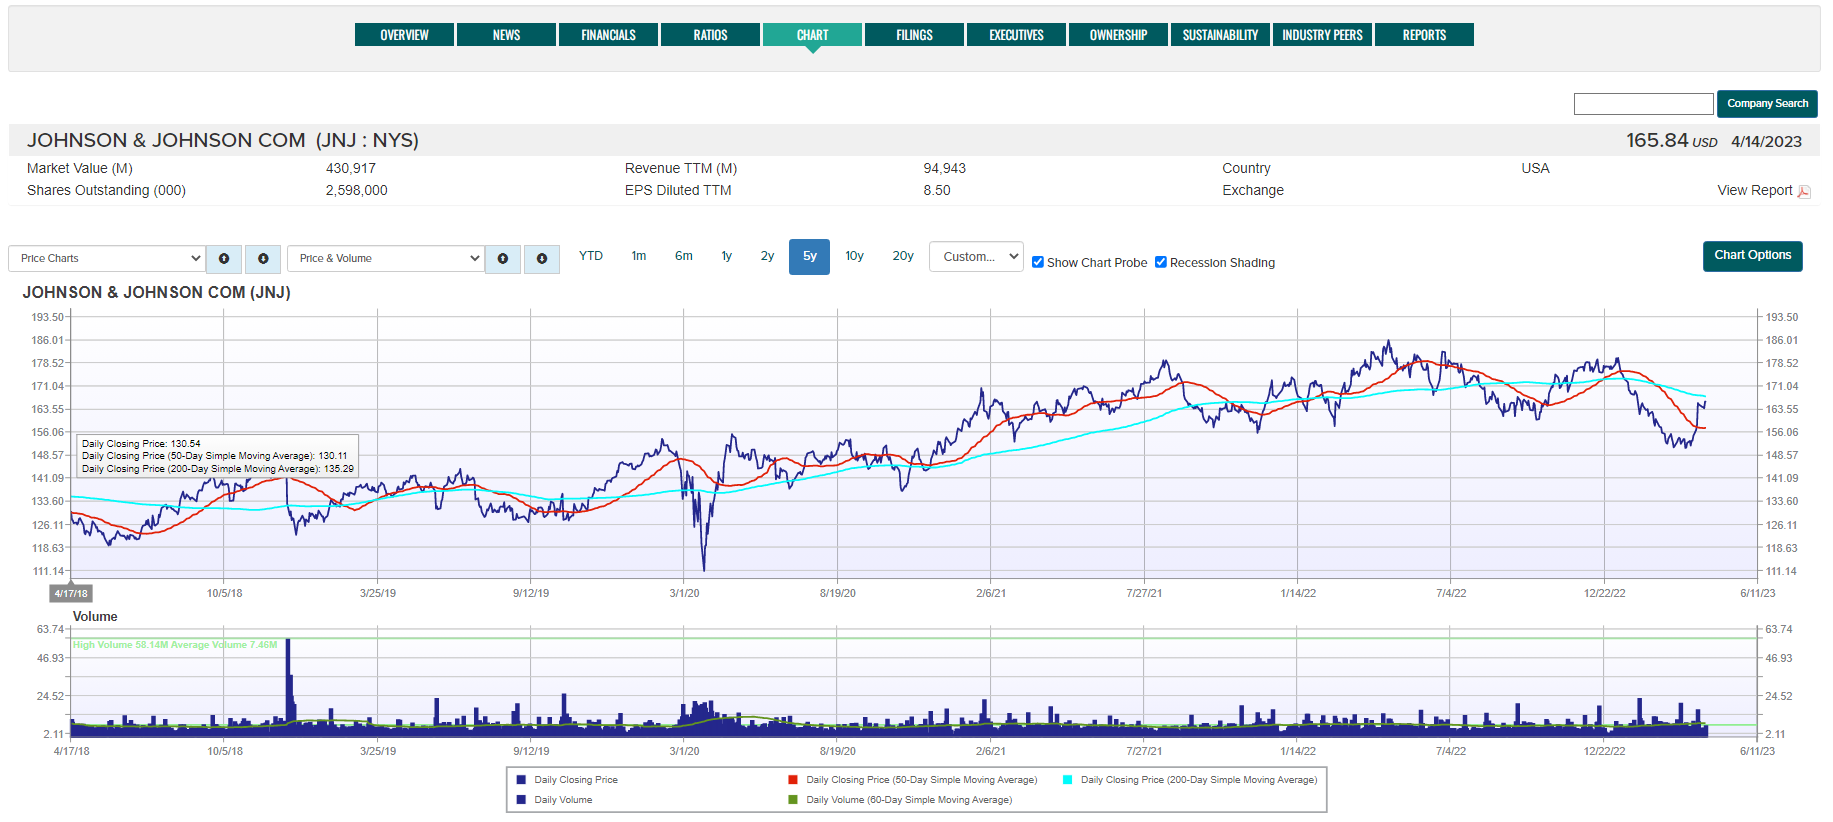
Chart Navigation - use the drop-down menus above the chart to select chart category (left drop-down) and chart type (right drop-down). Up and down arrows can be used to scroll through available categories and charts.
Chart Options:
- Use time period buttons or use further options under the Custom drop-down.
- Enable/disable the chart probe with the 'Show Chart Probe' check box.
- Enable/disable recession shading with the 'Recession Shading' check box.
- Use the Chart Options button to print the chart or download as PDF.
Filings
Search for a company's SEC or SEDAR regulatory filings.
- Select a time period using the dropdown list (default 1-Year).
- Select filing type (mouse over filing type names for a description of each).
- Use the More Filings dropdown to view additional filing selections.
- Use the Search button to display the resulting filings.
- Click on the PDF icon under the PDF Report column OR the Globe icon under the HTML Report column to view a filing.
- Click on the column headings to change the report sort order.
- Use the Reset button to return settings to default.
- Use the Export button to generate a CSV file containing the page data.

Executives
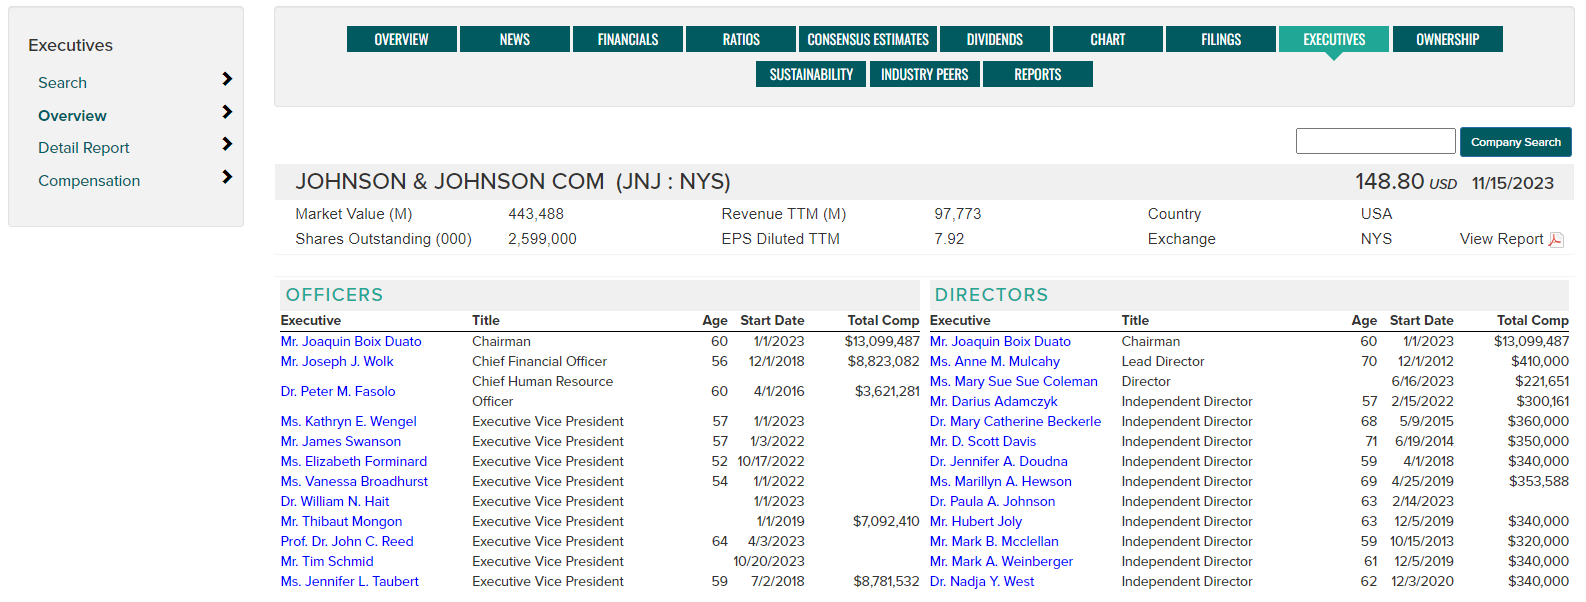
Executive Overview - Provides a snapshot of the company's current officers and directors. Mouse-over names for biographical information.
Executive Detail Report - Provides a full report of the current officers and directors including title, age, tenure, compensation, and biography. Use the 'Display page for printing' button to print.

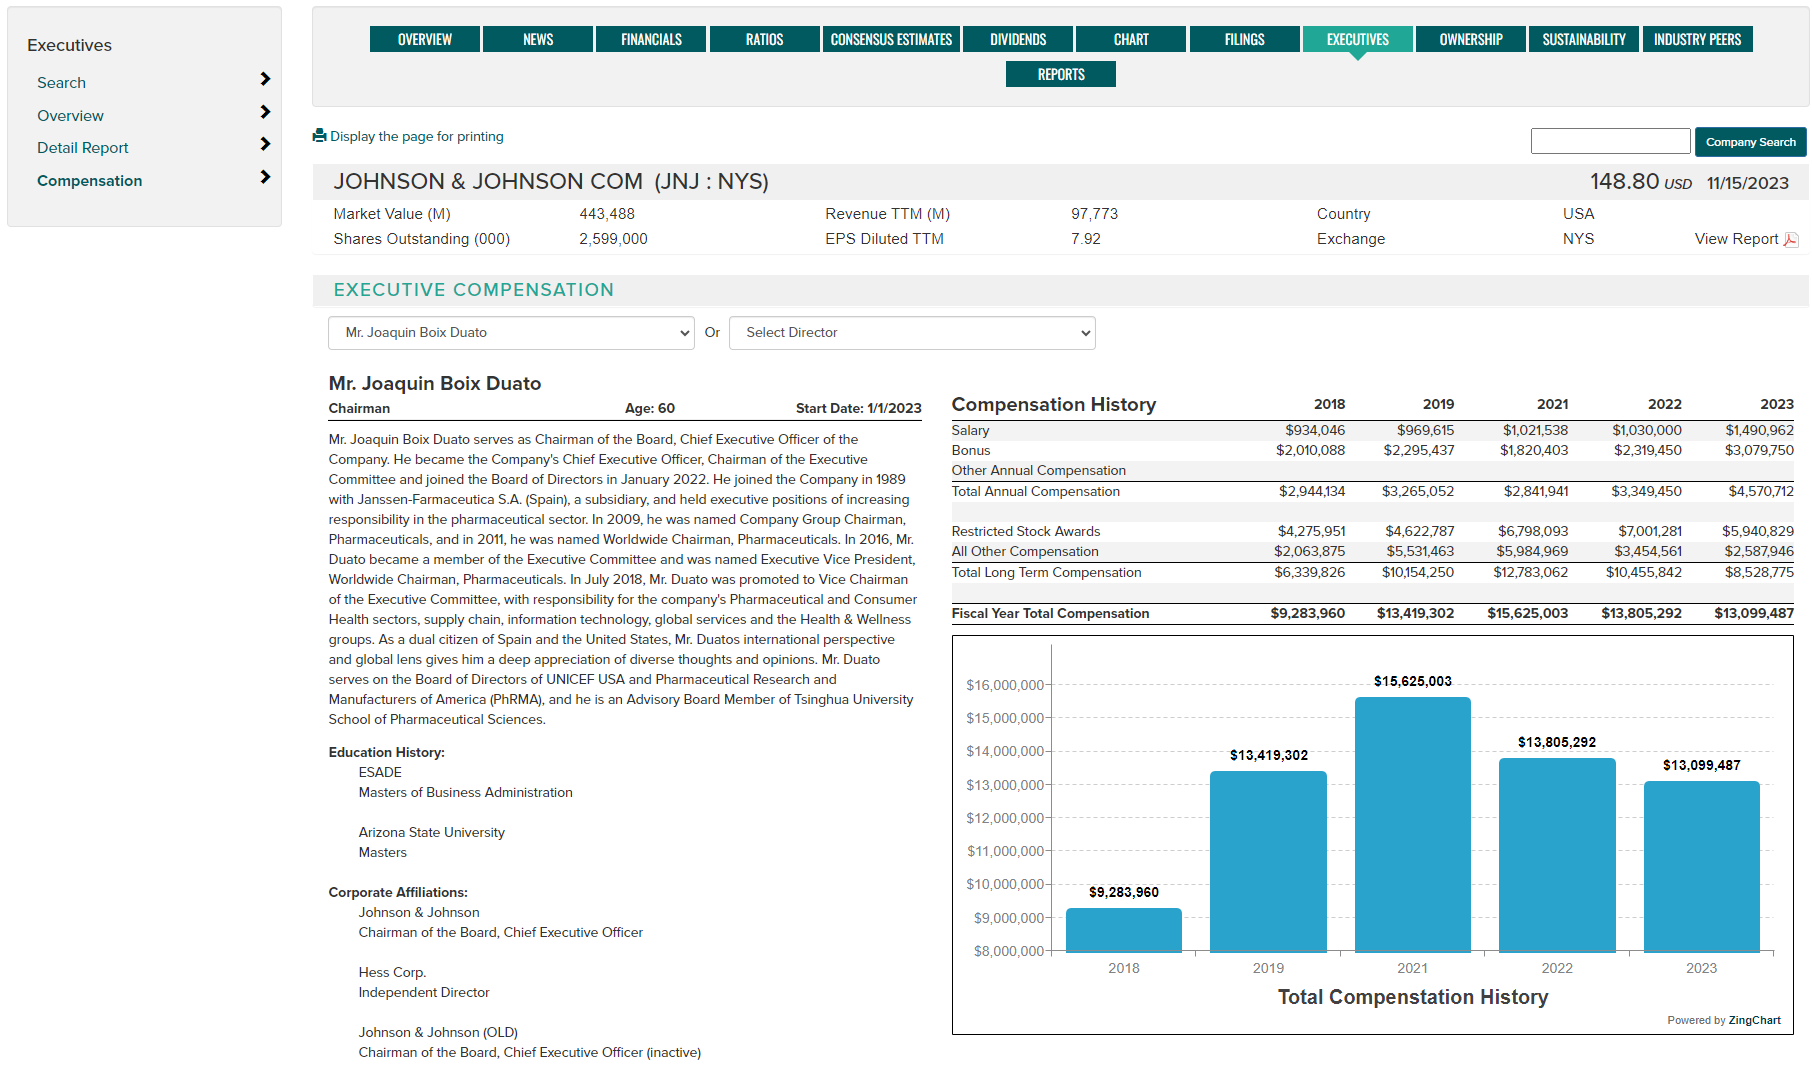
Executive Compensation - Use the drop-down menus to view individual officer and director's compensation history along with their biography. Use the 'Display page for printing' button to print.
Ownership
Access to Institutional Ownership, Insider Holdings and Insider Transactions.
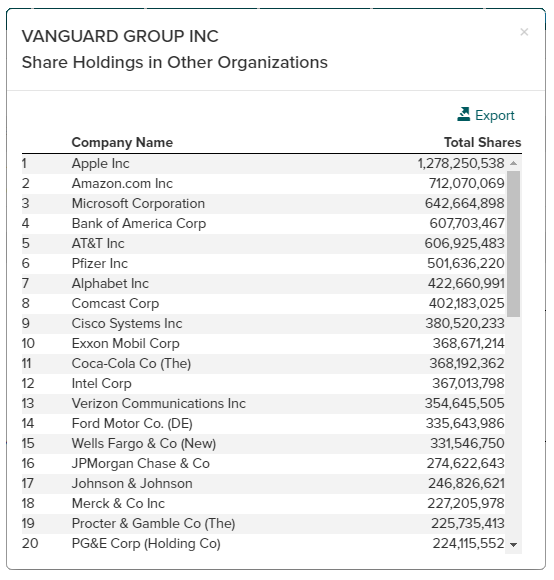
Institutional Ownership - View the top 25 institutions holding equity in the active company based on the latest filings. See which firms from the top 25 have the largest holding increases and decreases over the filing period.

Click on an institution name for a pop-up view of holdings in other companies.
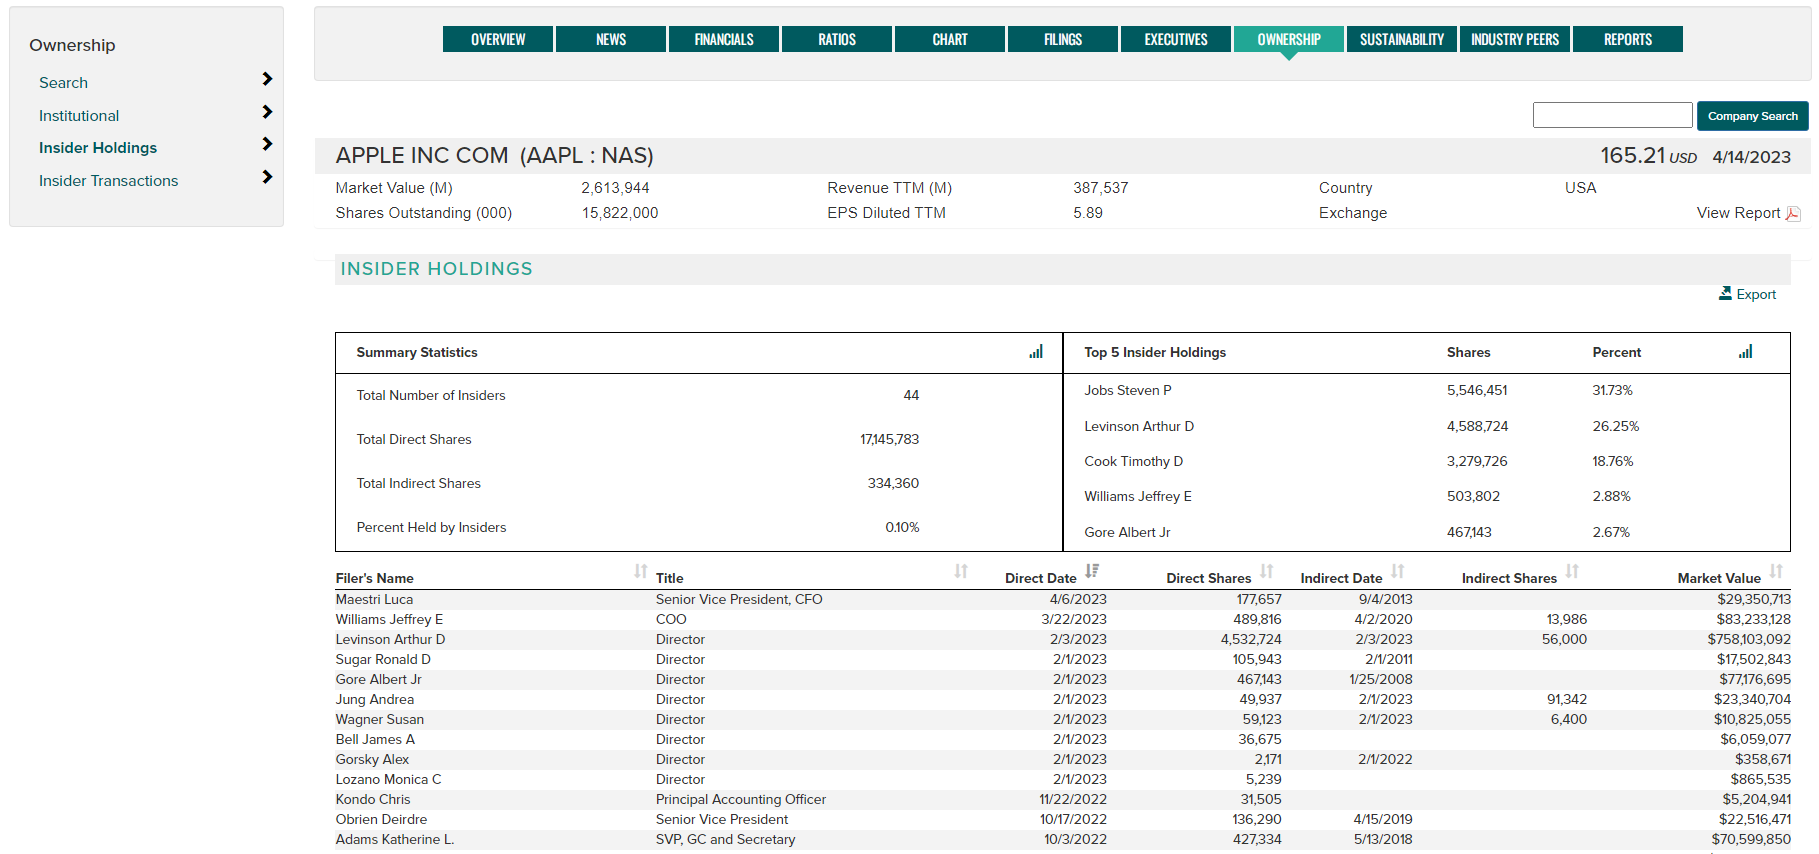
Insider Holdings - View summary information and direct and indirect insider holdings details based on SEC filings. Use the chart icon in the summary data sections to view data as pie chart. Click on holdings report headers to change report sorting. Use the Export button to export data to a CSV file.
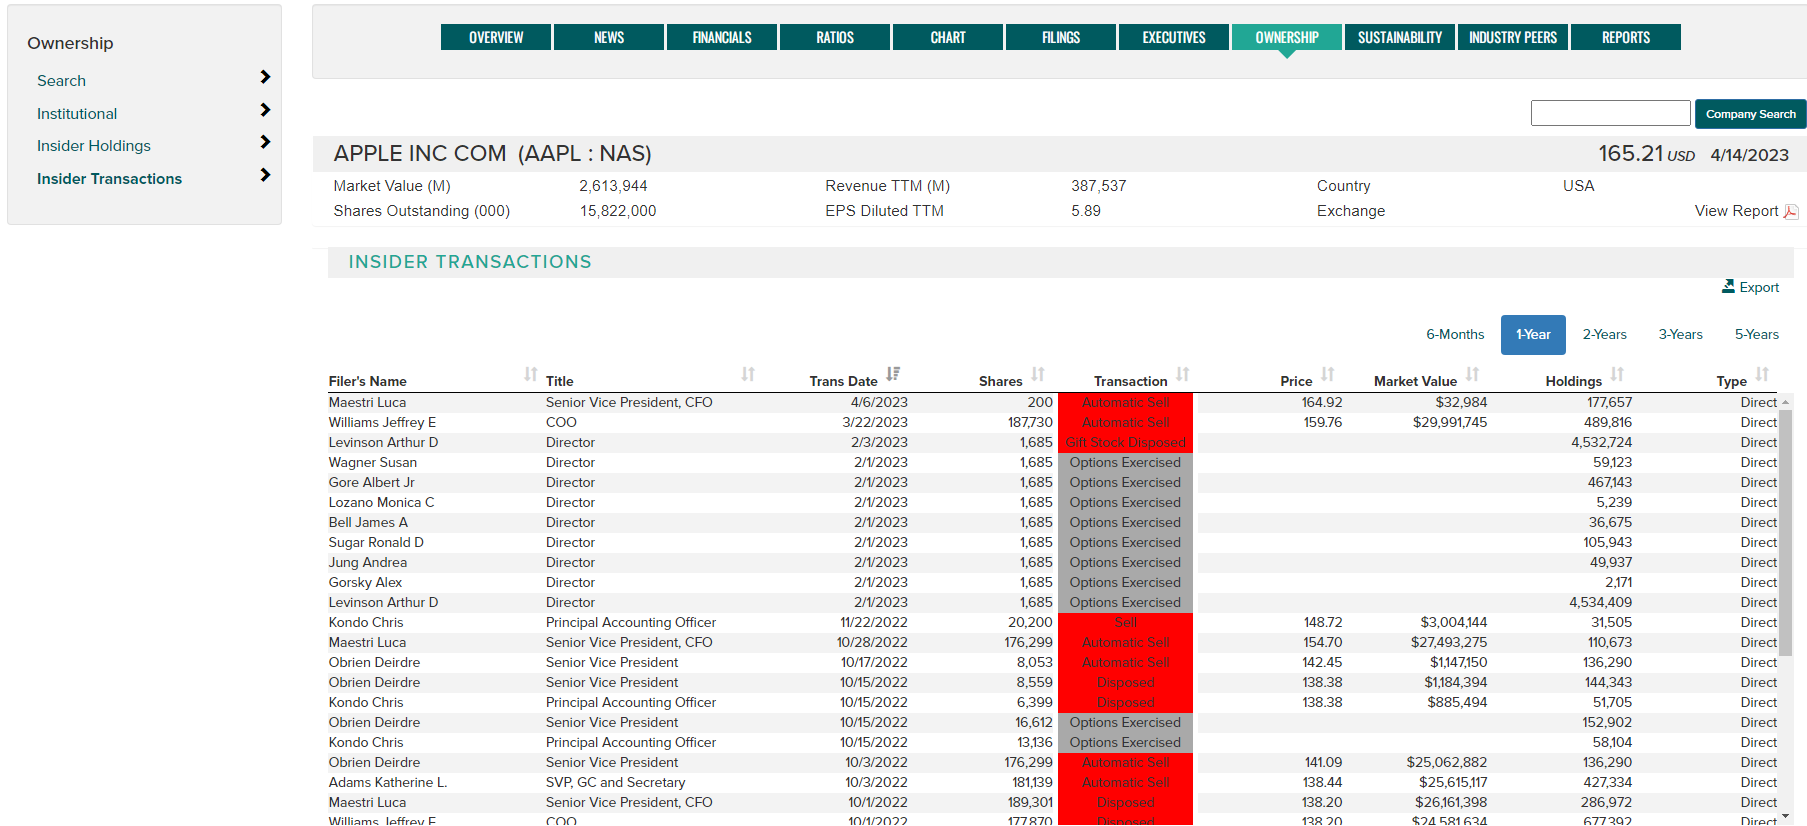
Insider Transactions - View insider transaction details based on SEC filings. Click on report headers to change report sorting. Use the time period buttons to view a variable amount of historical transactions. Use the Export button to export data to a CSV file.
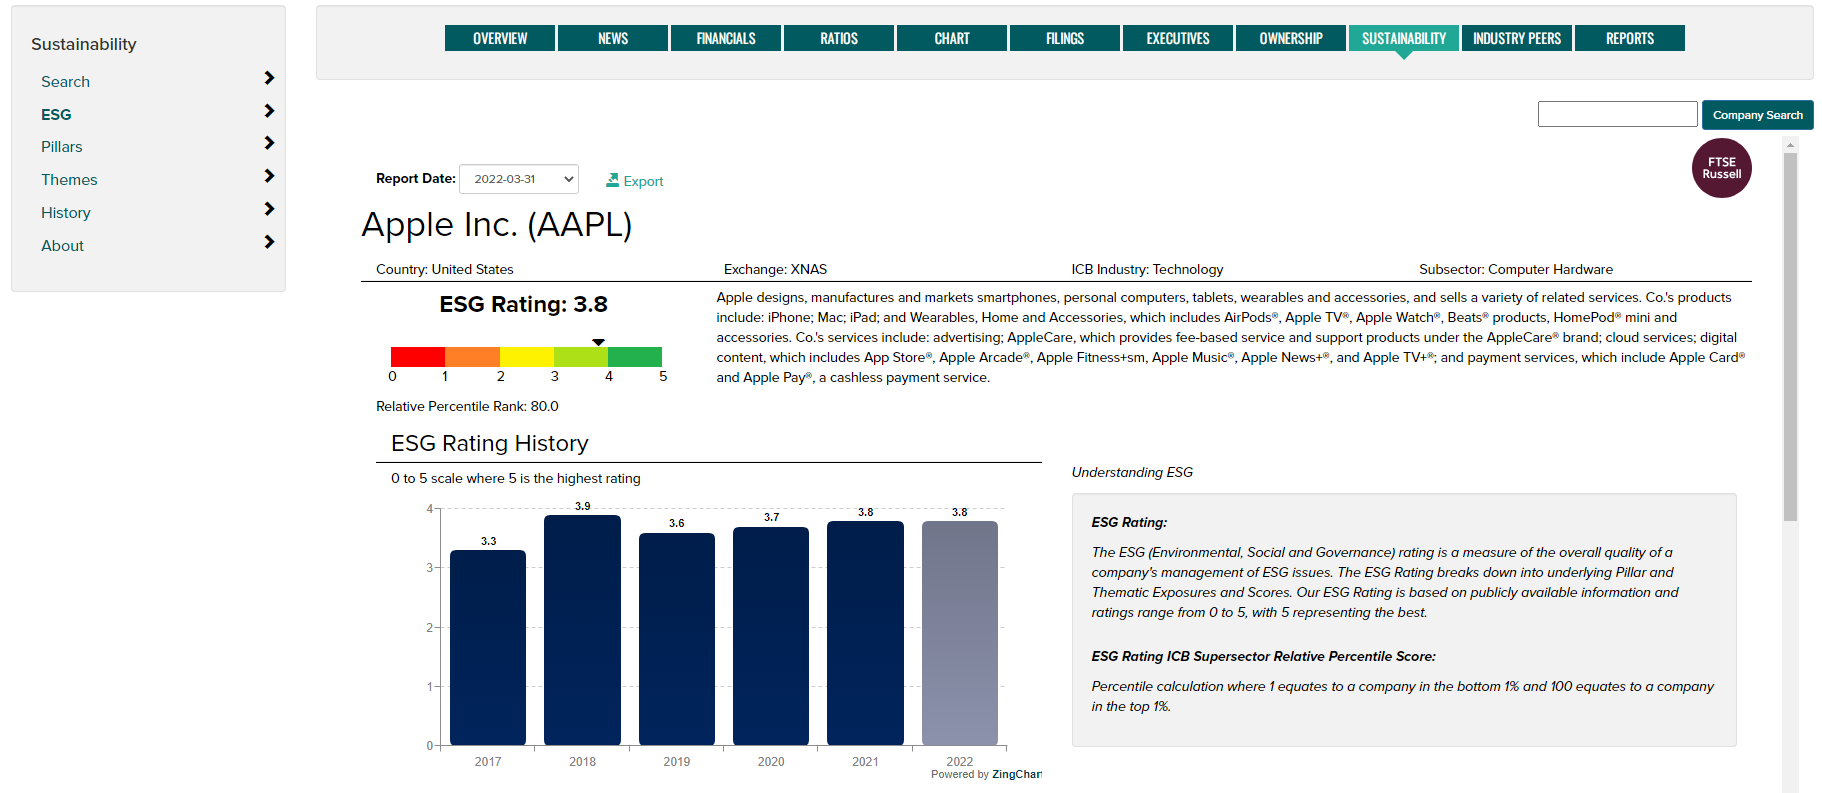
Sustainability
View FTSE Russell ESG Ratings measuring a company's Environmental, Social, and Governance risk. Coverage includes over 7,000 securities across 47 Developed and Emerging markets. ESG Ratings allow investors to understand a company's exposure to, and management of, ESG issues in multiple dimensions. To learn more about ESG Ratings, visit https://www.ftserussell.com/data/sustainability-and-esg-data/esg-ratings
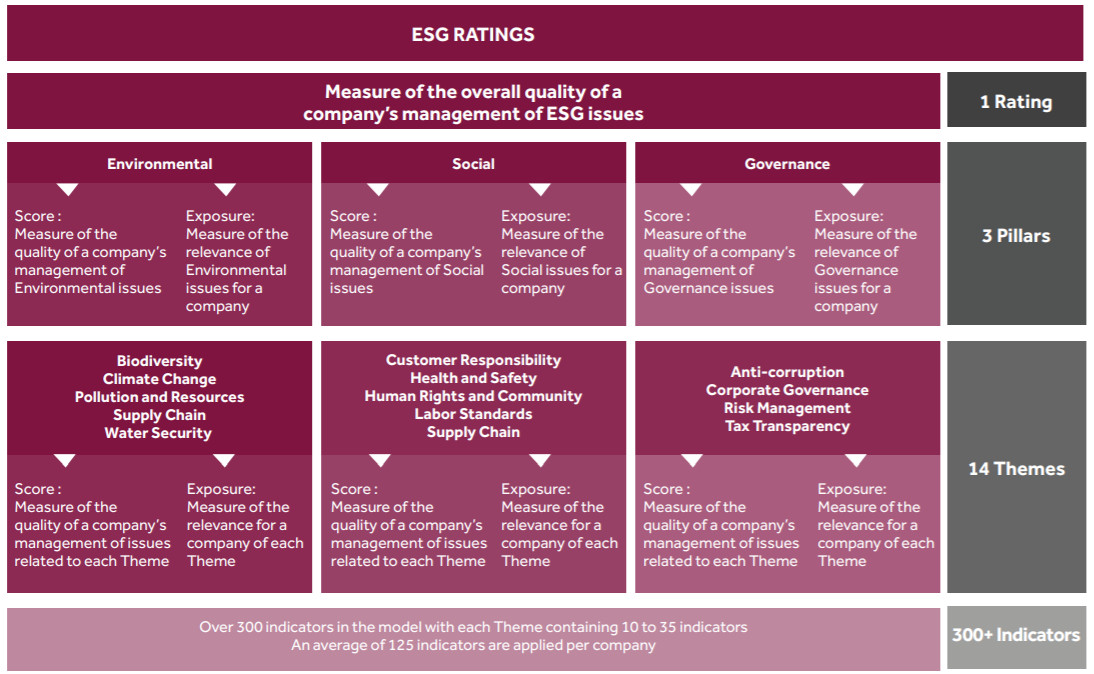
ESG Ratings represent an overall Rating that breaks down into underlying Pillar and Theme Exposures and Scores. Pillars and Themes built on over 300 individual indicator assessments that are applied to each company's unique circumstances.
- Use the left navigation controls to change from ESG, Pillar, Theme, History and About ratings pages.
- Use the Report Date dropdown to choose a report period.
- Use the Export button to export the data to a CSV file.
- Historical ratings data can be viewed in table and chart form from the History page. Use the Table and Chart buttons to toggle the display format.
Sustainability Definitions
ESG Rating: A measure of the overall quality of a company's management of ESG (Environmental, Social and Governance) issues. The ESG Rating breaks down into underlying Pillar and Thematic Exposures and Scores. Our ESG Rating is based on publicly available information and ratings range from 0 to 5, with 5 representing the best rating.
ESG Pillar: A cumulative score for each Pillar (i.e. Environmental, Social and Governance). Scores range from 0 to 5, with 5 representing the best.
ESG Themes: A total of 14 individual ESG Themes make up FTSE Russell's ESG Data Model. The applicability of each ESG Theme to companies in the research universe is based on how exposed they are to each Theme. These 'Exposure Levels' are based on factors including a company's sector and where it operated geographically.
ESG Rating ICB Supersector Relative Percentile Score: Percentile calculation where 1 equates to a company in the bottom 1% and 100 equates to a company in the top 1%.
ESG Ratings: data structure
The ESG Rating and data model allows investors to understand a company's exposure to, and management of, ESG issues in multiple dimensions. The ESG Ratings are comprised of an overall Rating that breaks down into underlying Pillar and Thematic Exposures and Scores. The Pillars and Themes are built on over 300 individual indicator assessments that are applied to each company's unique circumstances.
Supply Chain
View details related to a company's industry, products/services, competitors, customers, suppliers and partners. Generate reports based on hypothetical Merger and Acquisition scenarios. Note: Supply chain data is an add-on service which is only available under additional subscription terms.
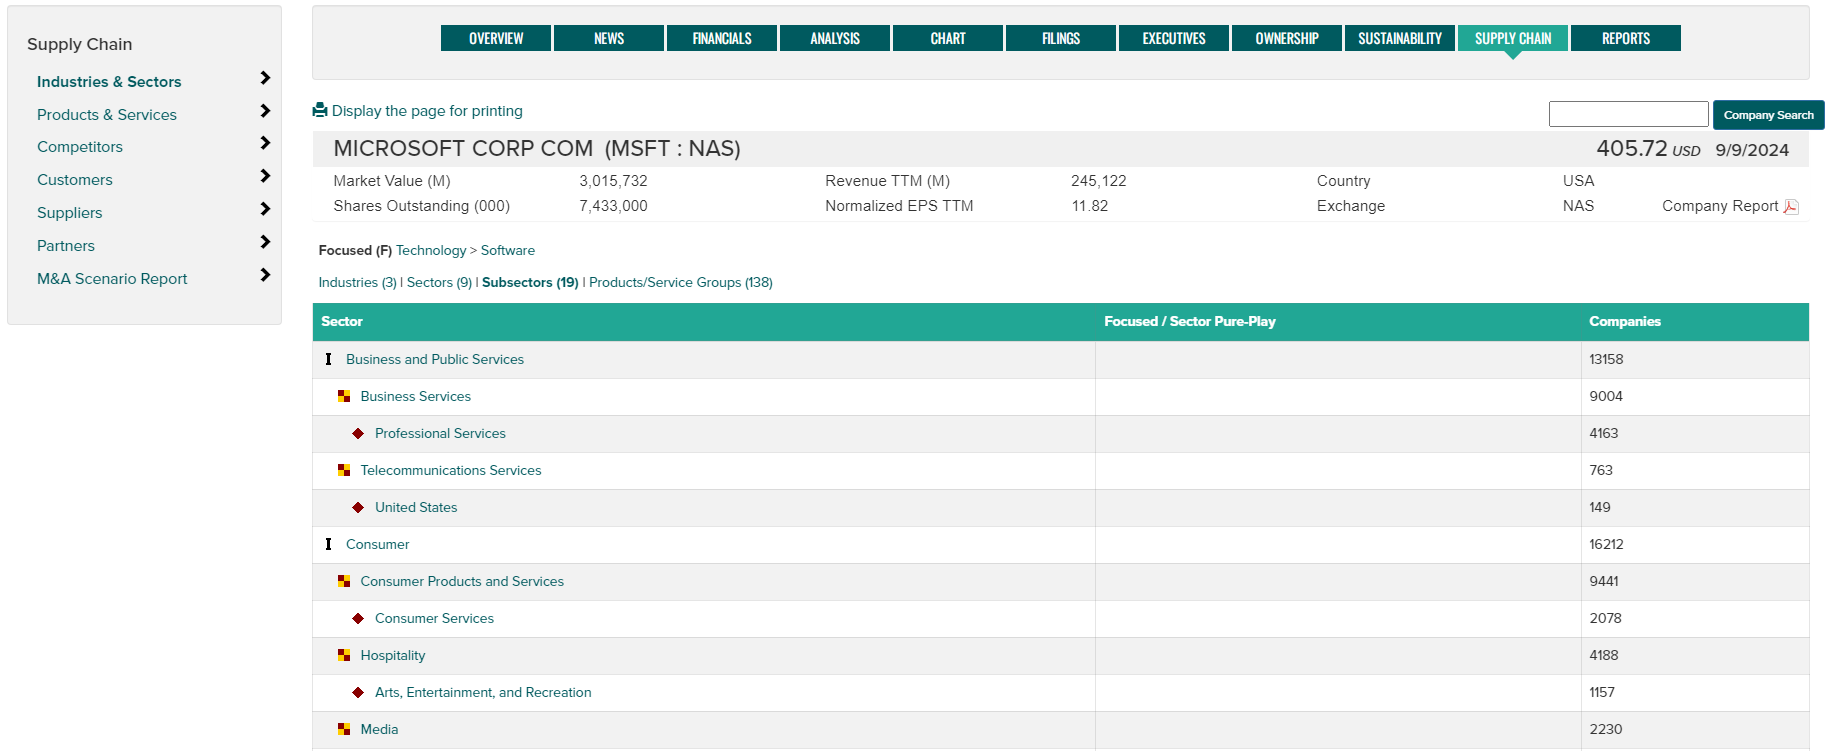
- Industries & Sectors - double click sector names to view company and competitor products/services in the given sector.
Focused / Sector Pure-play notes:
F = Focused, Denotes that the company is considered focused in this area. In general, Focused Companies draw the majority of their earnings in the sector/product area specified.
P = Sector Pure-plays, Denotes that the company is focused in the selected sector and has no presence in any other branch of the Revere Hierarchy.
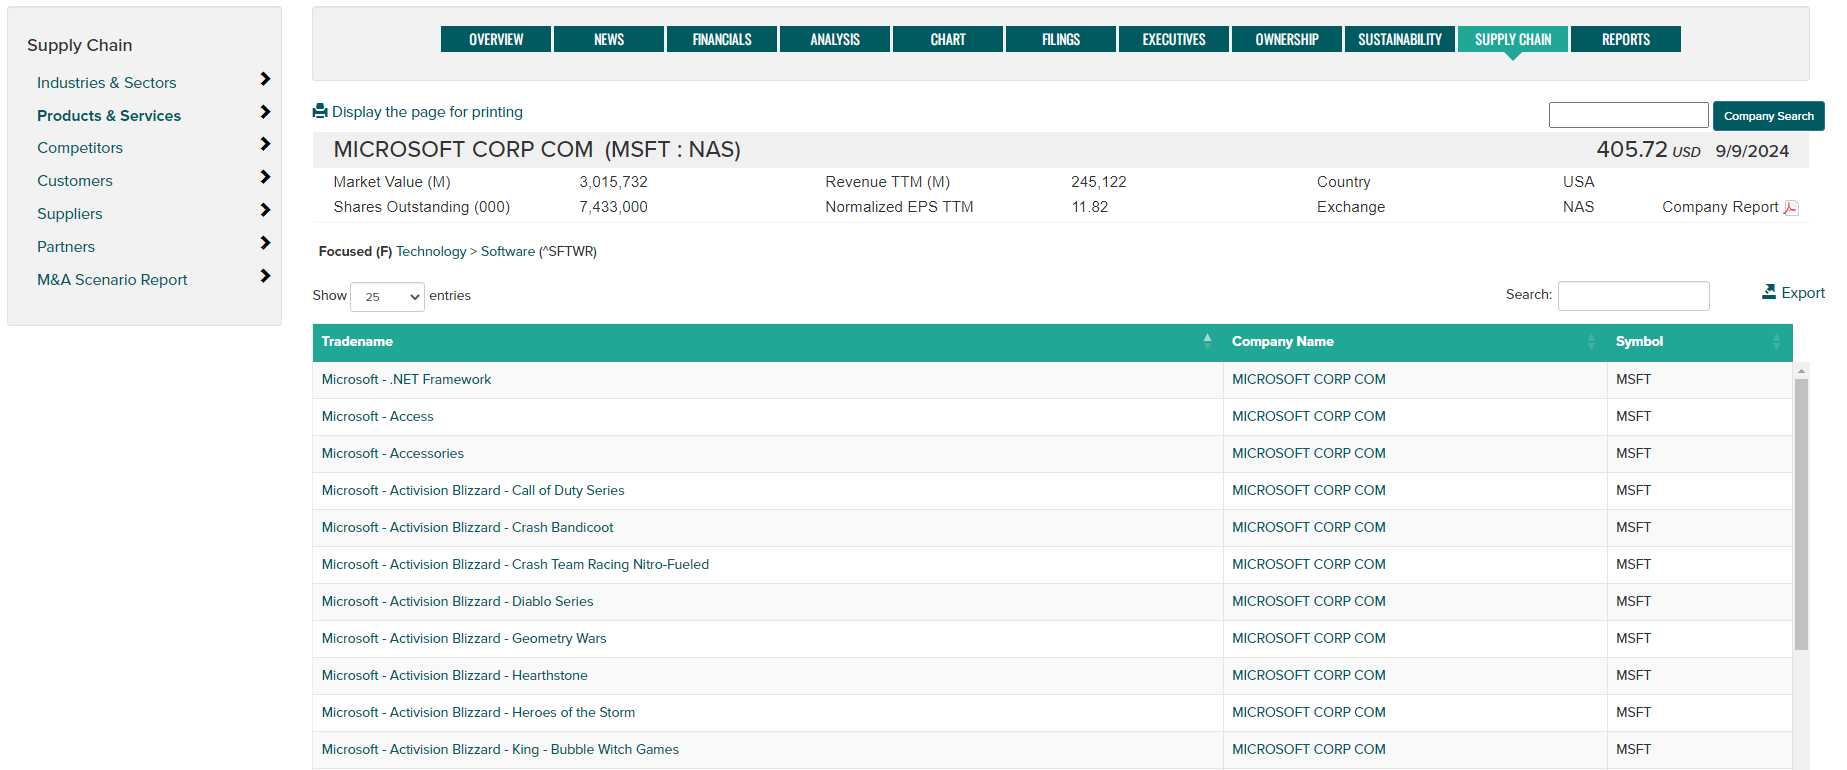
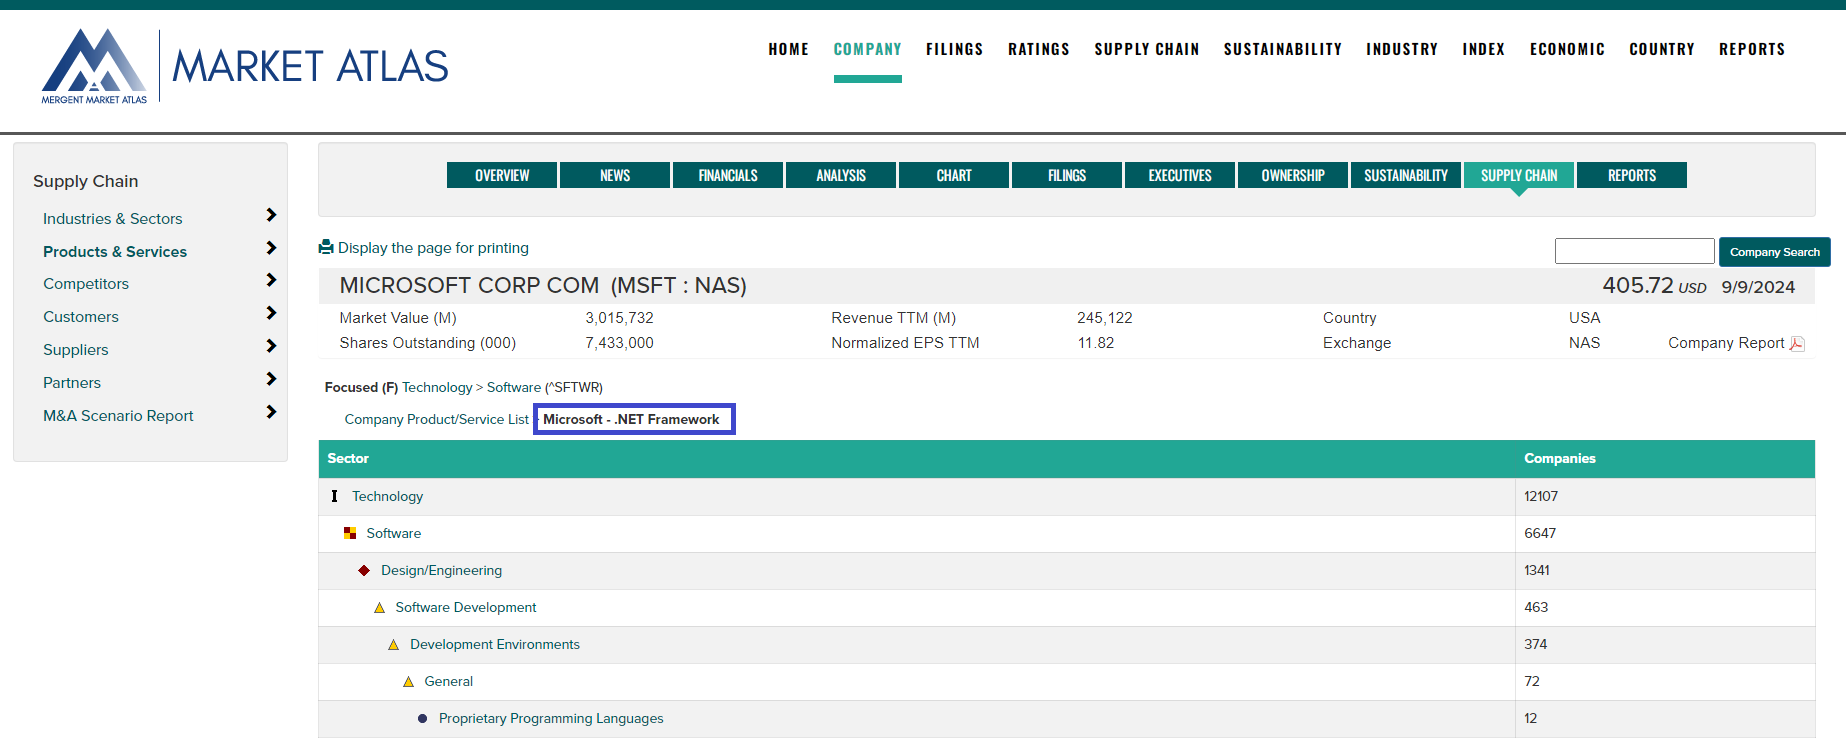
- Products & Services - click on a Tradename to view sector detail for the product.
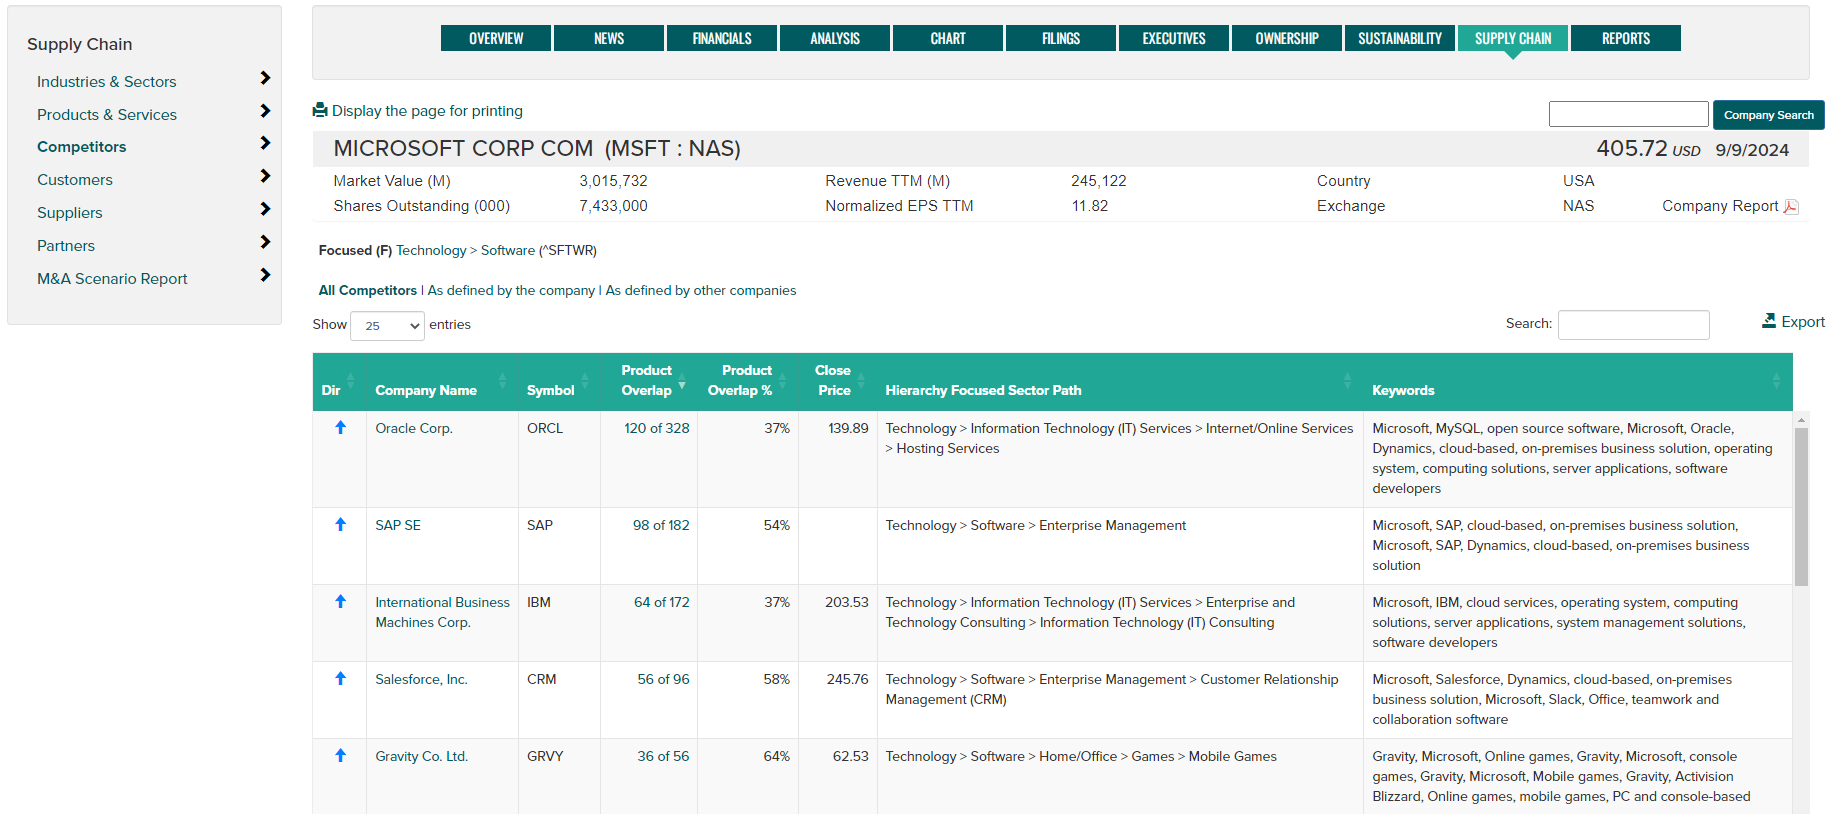
- Competitors - click on competitor name to jump to their supply chain data.
Product Overlap - Signifies the number of competitor products placed at the same level of the hierarchy. Direct competitors sometimes compete in the same market but have 0 product overlap due to differences in the basic technology or industry class of the competing products.
Directional arrow notes: Right arrow - defined by company, Left arrow = defined by others, Up arrow = defined by both.
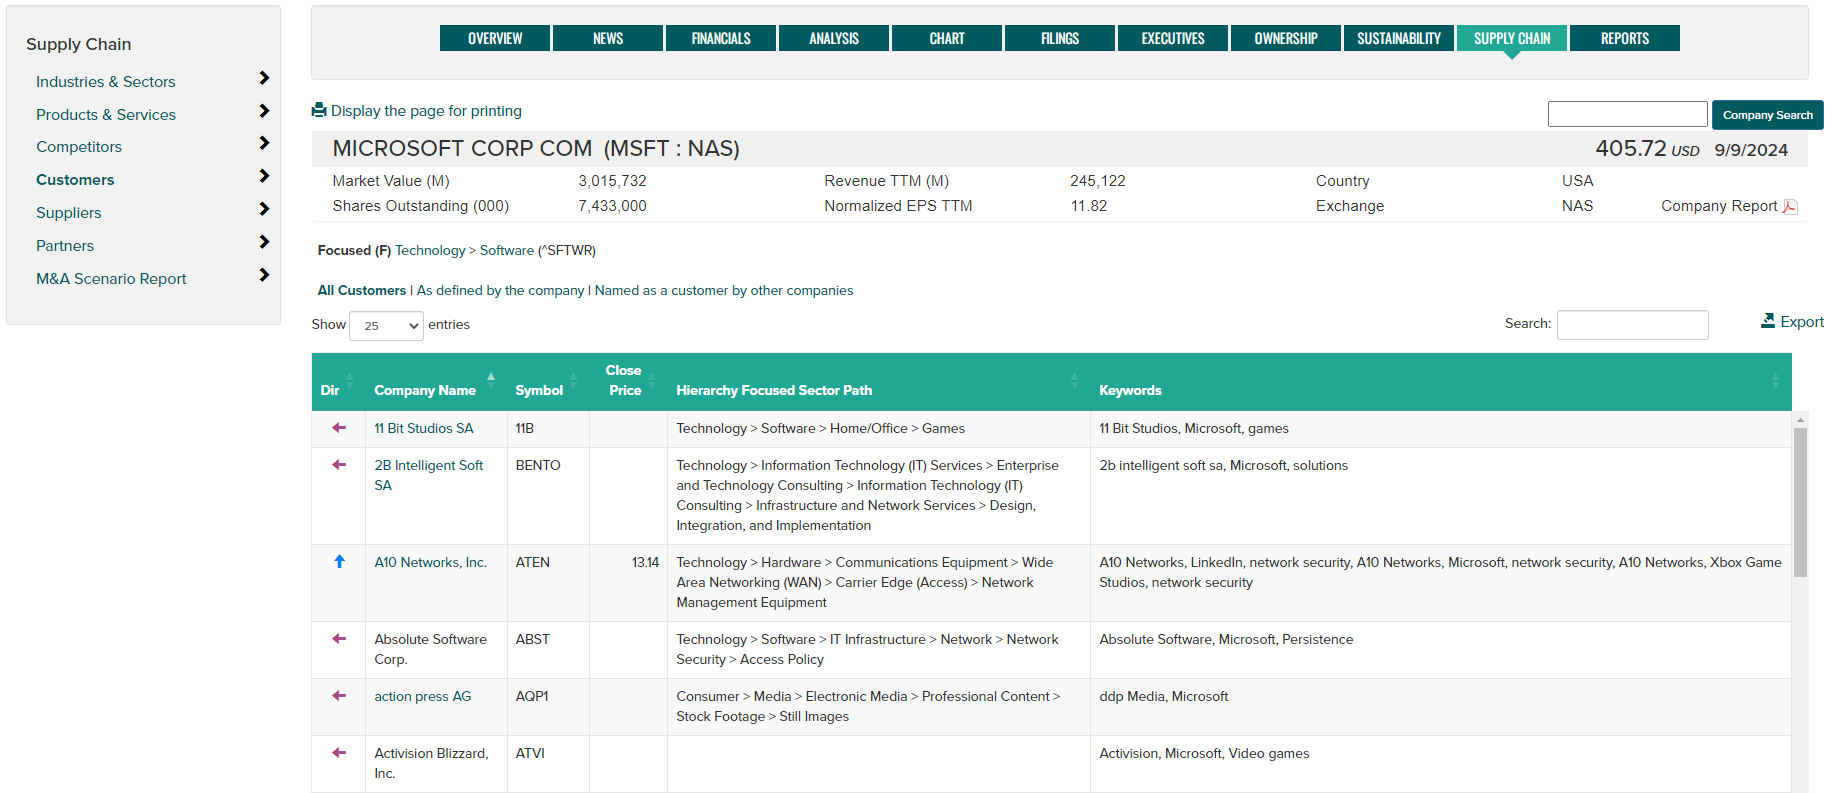
- Customers - click on customer name to jump to their supply chain data.
Directional arrow notes: Right arrow - defined by company, Left arrow = defined by others, Up arrow = defined by both.
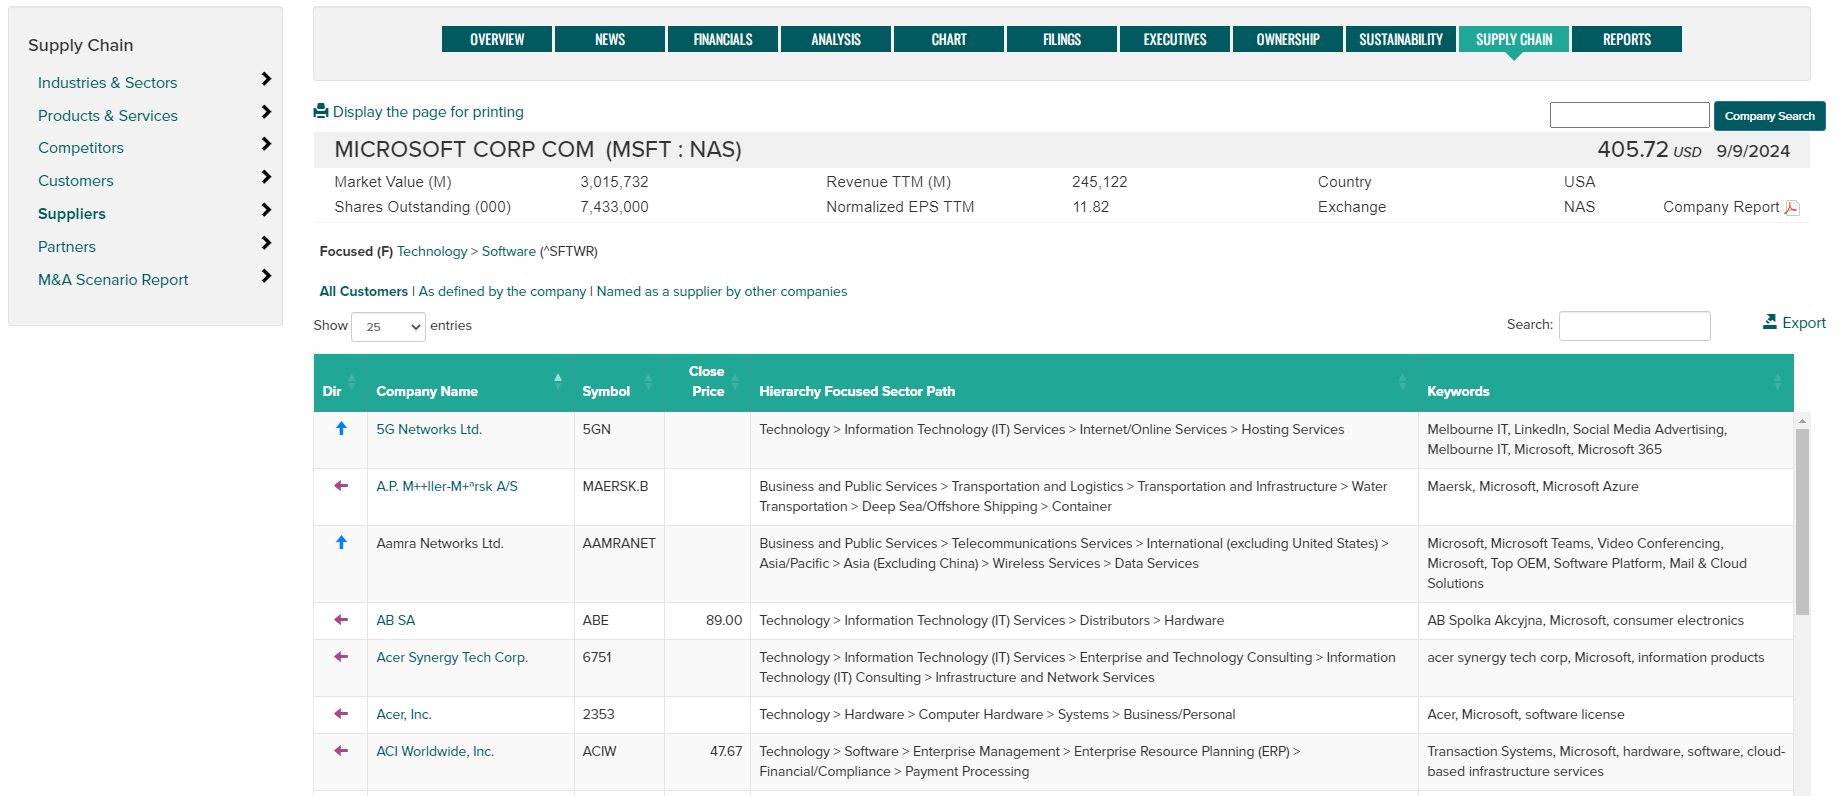
- Suppliers - click on supplier name to jump to their supply chain data.
Directional arrow notes: Right arrow - defined by company, Left arrow = defined by others, Up arrow = defined by both.
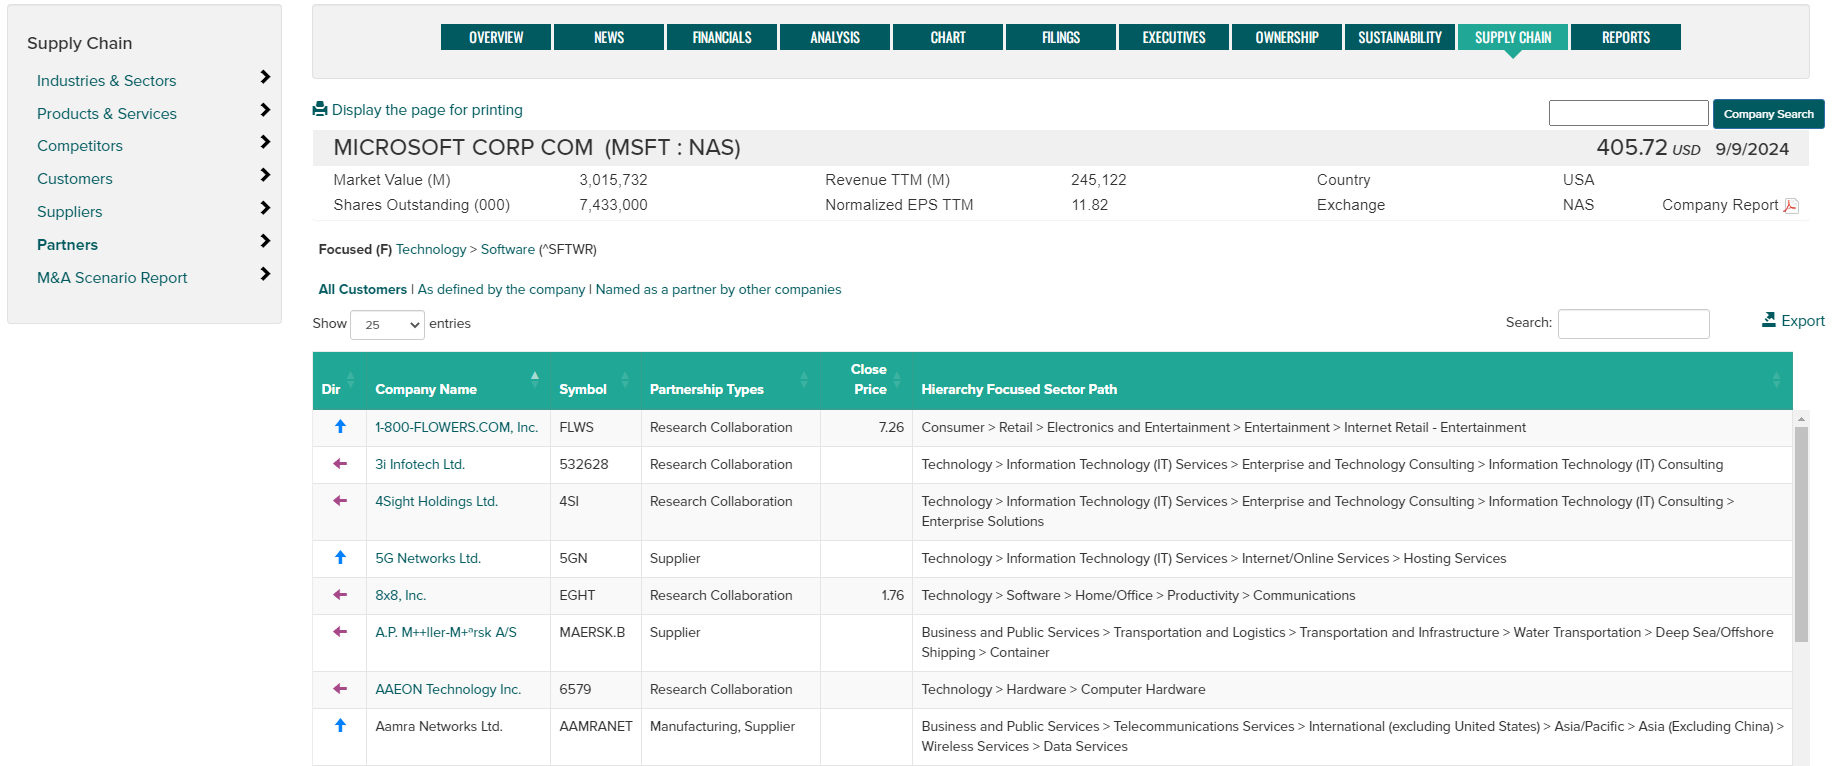
- Partners - click on partner name to jump to their supply chain data.
Directional arrow notes: Right arrow - defined by company, Left arrow = defined by others, Up arrow = defined by both.
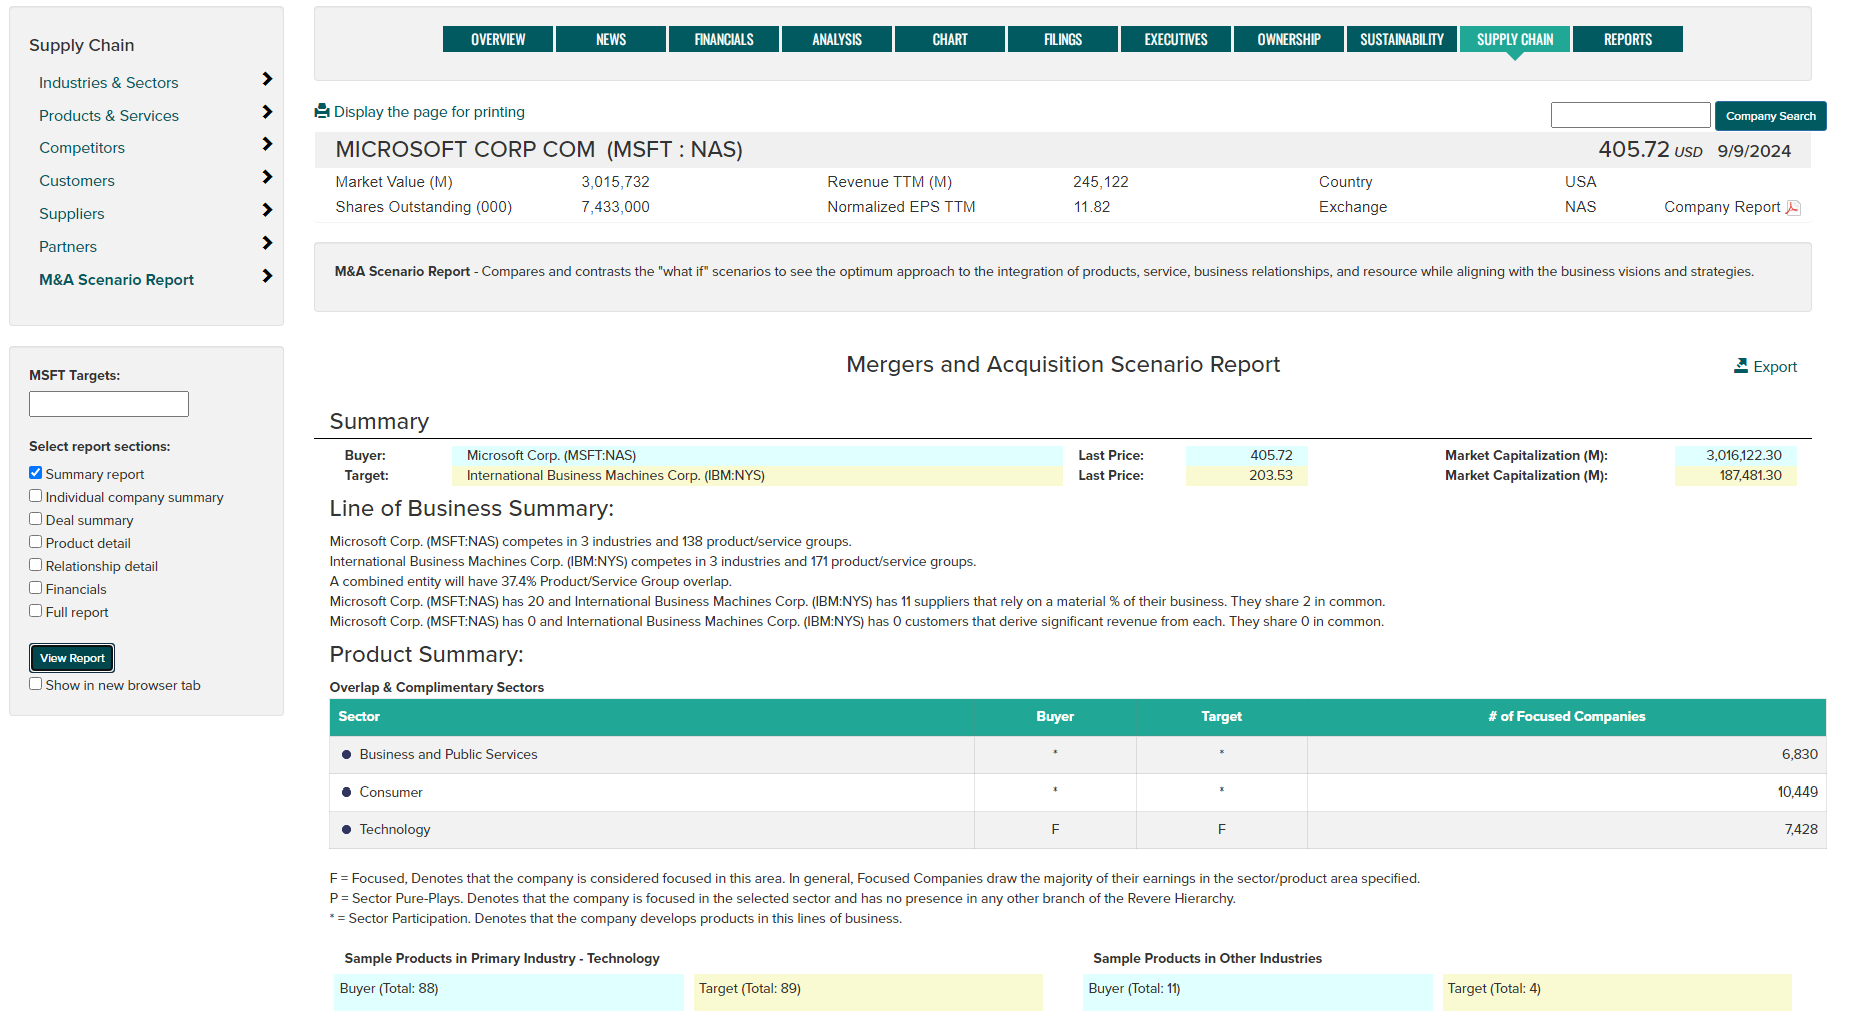
- M&A Scenario Report - Compares and contrasts the "what if" scenarios to see the optimum approach to the integration of products, service, business relationships, and resources while aligning with the business visions and stategies.
Enter a target company name or symbol in the target entry box on the left hand navigation bar, then select the report type(s) to generate followed by the View Report button.
Optionally, use the check box to generate the report in a new browser tab.
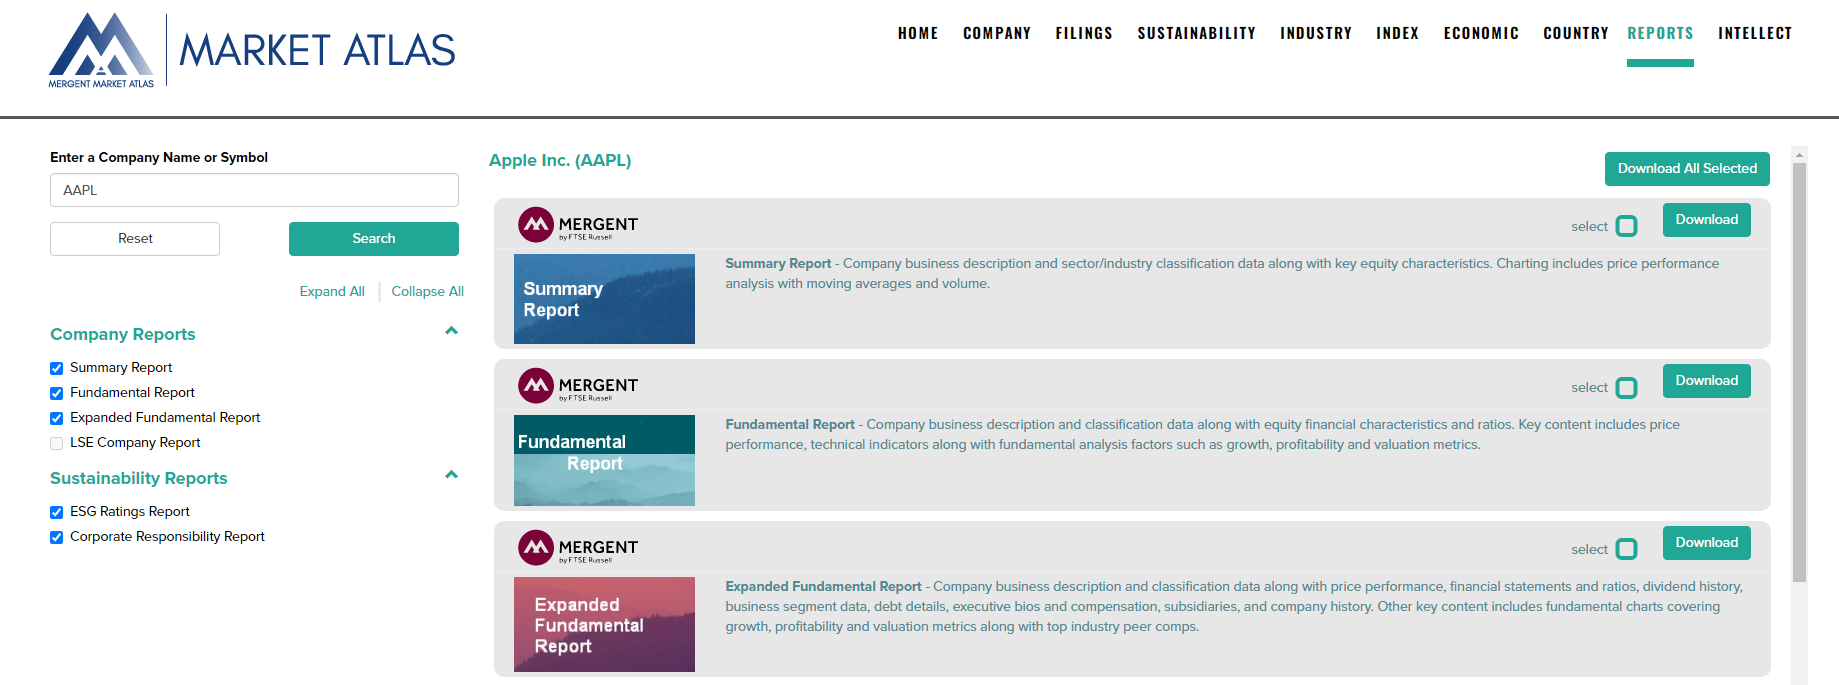
Reports
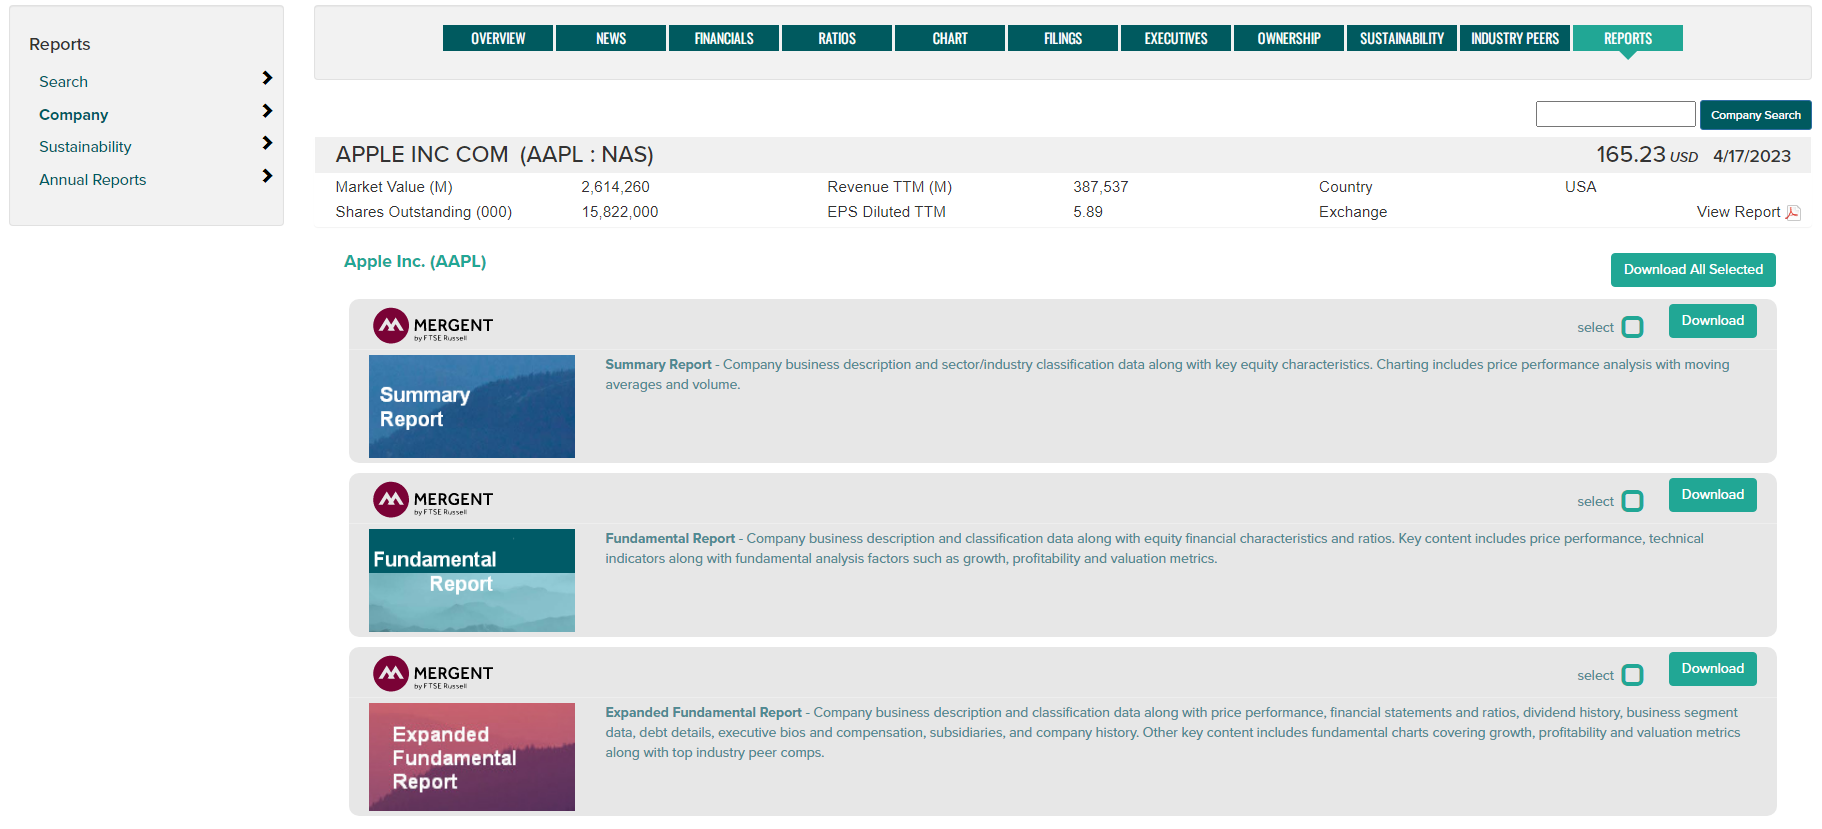
Access a variety of company PDF reports using the left navigation controls to change between company, rating, sustainability, and annual reports. Click on the Download button to retrieve an individual report or use the 'select' check boxes to choose multiple reports followed by the Download All Selected button. Use the Custom Report option to create company reports based on selected content.
Report types include:
- Summary Report - Company business description and sector/industry classification data along with key equity characteristics. Charting includes price performance analysis with moving averages and volume.
- Fundamental Report - Company business description and classification data along with equity financial characteristics and ratios. Key content includes price performance, technical indicators along with fundamental analysis factors such as growth, profitability and valuation metrics.
- Expanded Fundamental Report - Company business description and classification data along with price performance, financial statements and ratios, dividend history, business segment data, executive bios and compensation. Other key content includes fundamental charts covering growth, profitability and valuation metrics along with top industry peer comps.
- Company Rating Report - A proprietary stock rating report which analyze key trends in earnings, fundamentals, relative valuation, price momentum, risk and insider trading. Stock Reports Plus optimize investment selection by simplifying the process of evaluating stocks and finding new trading ideas. Scores range from 10 (positive) to 1 (negative).
- ESG Rating Report - Environmental, Social and Governance report measuring a company's exposure to, and management of, ESG issues through charts and tables. Data includes business description, ICB classification information, ESG rating, rating history, pillar scores, country and industry averages, and their exposure.
- Corporate Social Responsibility (CSR) - Periodic reports published by companies to share their corporate responsibility actions and results. CSR reports expose how the company is incorporating principles of sustainable development into their operations.
- Annual Reports - Company annual reports as published by the company.
- Custom Reports - Design and generate custom company reports using multiple content options including financials, ratios, business segments, pricing charts, consensus estimates, company executives, supply chain data and more.
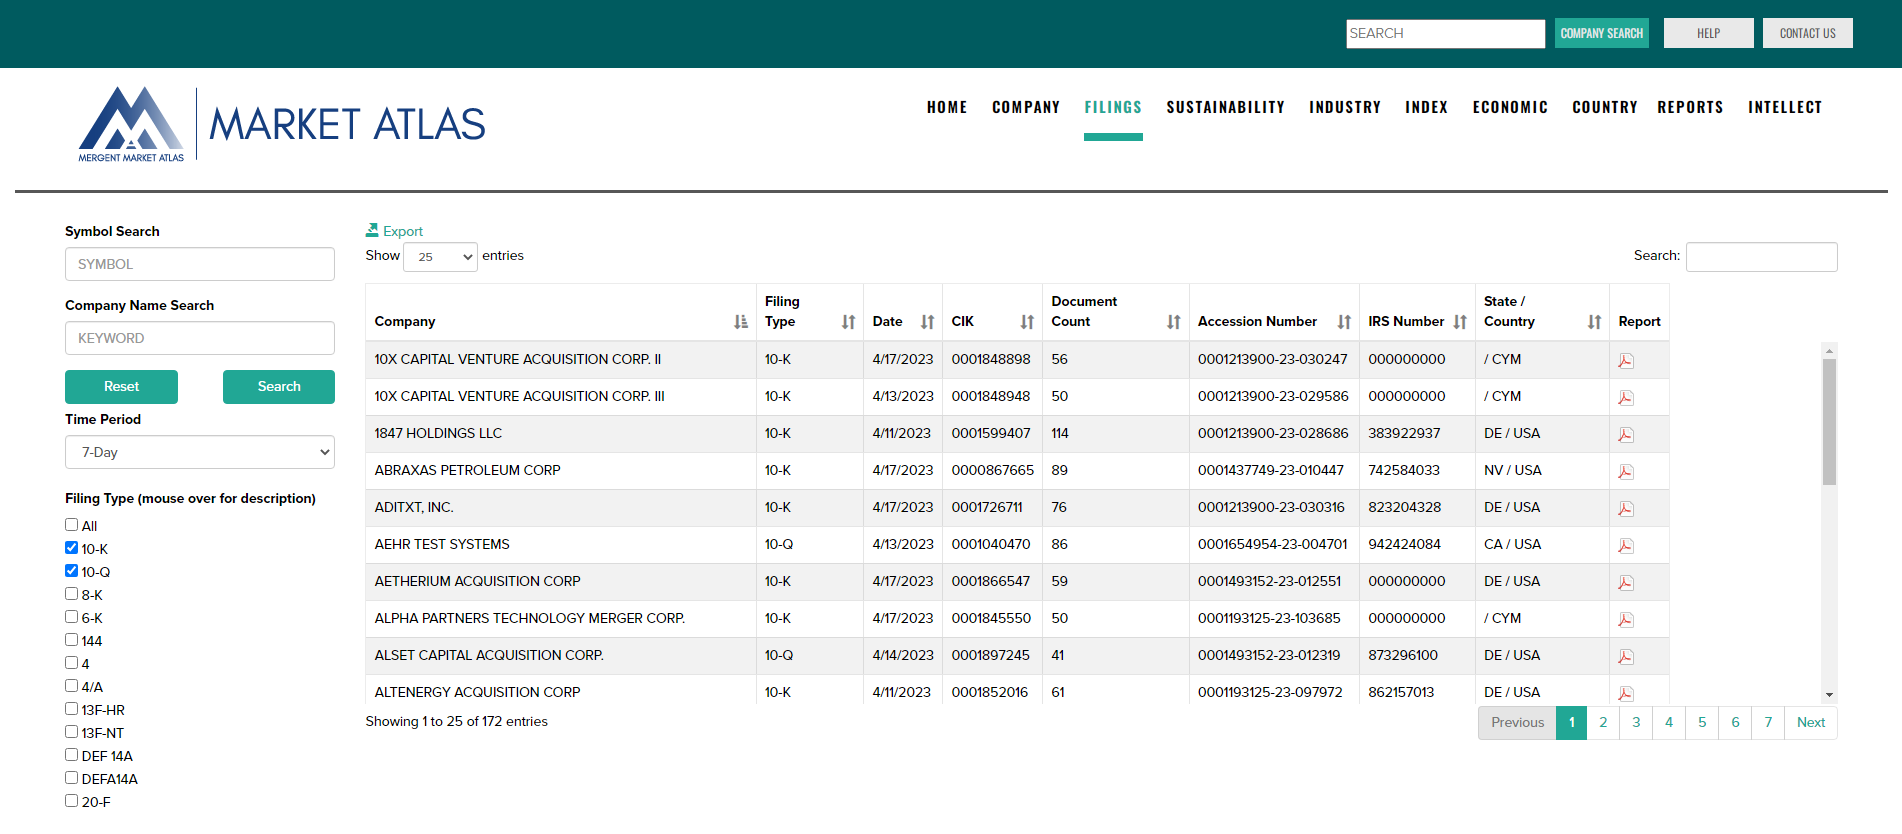
Filings
Search for company regulatory filings as follows:
- Choose between SEC Filings and SEDAR (Canadian) Filings.
- Search by company ticker symbol or name.
- Select a historical time period, note that a custom time range can be entered.
- Select filing types using the check boxes (mouse over filing type names for a description of each).
- Additional filing types can be found using the More Filings option.
- Use the Search button to display the resulting filings.
- Click on the PDF icon under the PDF Report column OR the Globe icon under the HTML Report column to view a filing.
- Click on the column headings to change the report sort order.
- Use the Reset button to return settings to default.
- Use the Export button to generate a CSV file containing the page data.
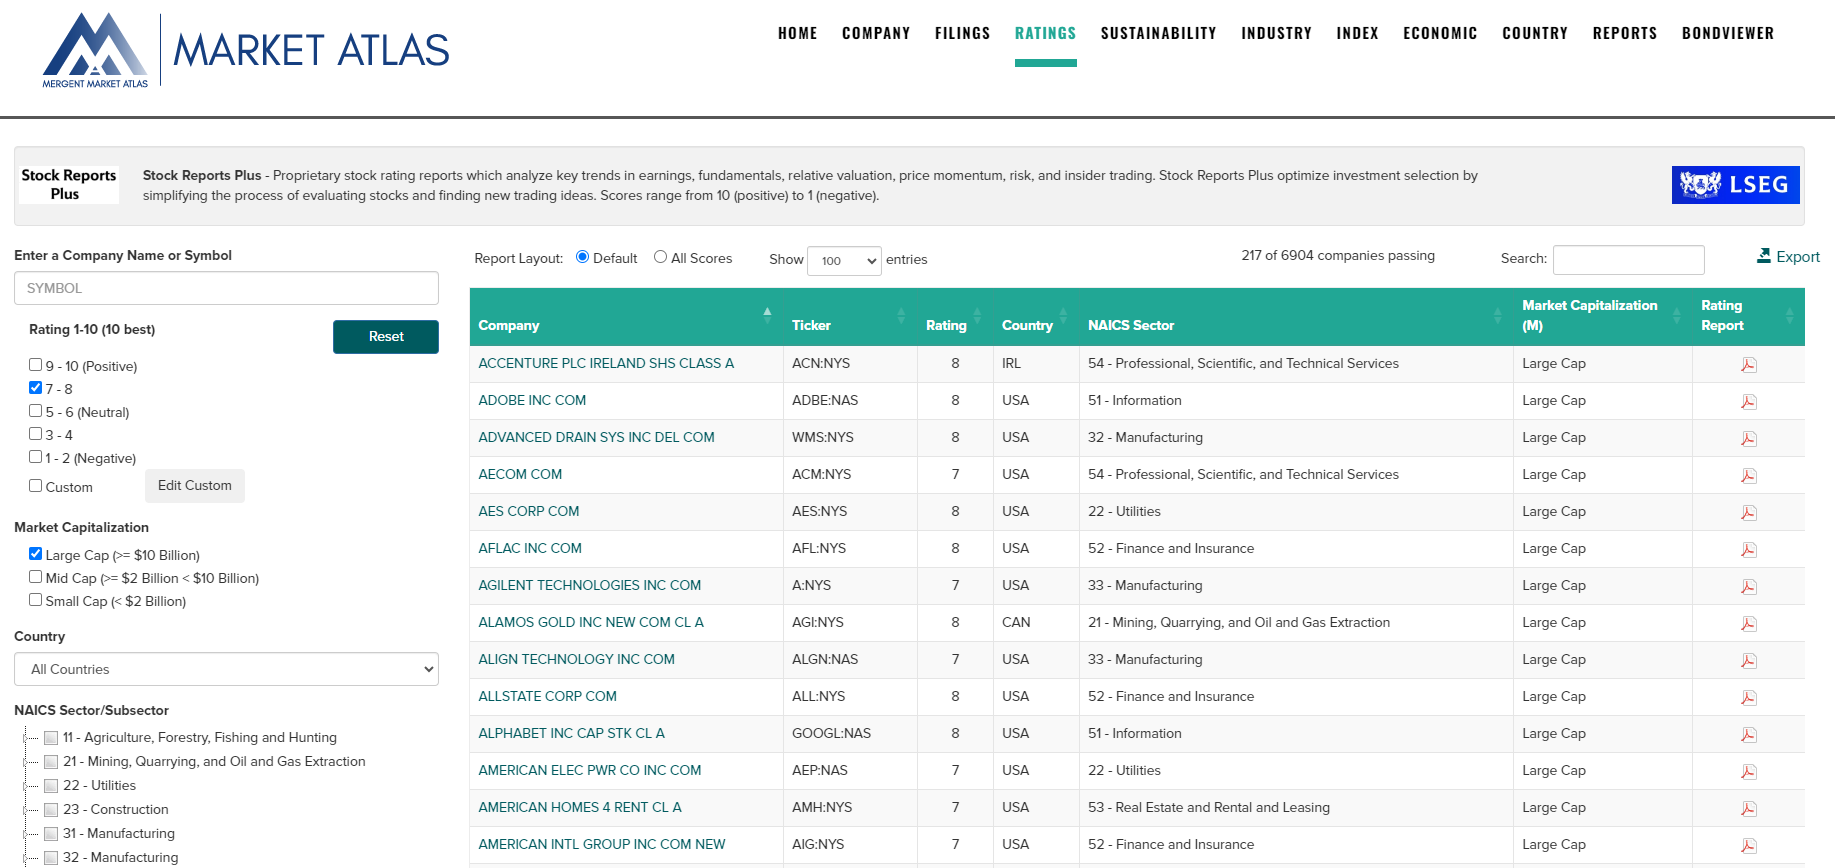
Ratings
Stock Reports Plus are 10-page proprietary stock rating reports which analyze key trends in earnings, fundamentals, relative valuation, price momentum, risk, and insider trading. The reports optimize investment selection by simplifying the process of evaluating stocks vs. peers and finding new trading ideas. Scores range from 10 (positive) to 1 (negative).
The reports are available within three areas of Market Atlas: Ratings search from the main menu, Reports from the main menu and the Company/Reports page.
From the Main Menu select Ratings then use the left panel tools to search for reports using the following criteria:
a. Company name/symbol
b. Average rating value
c. Custom rating score combinations
d. Market Capitalization
e. NAICS Sector/Subsector
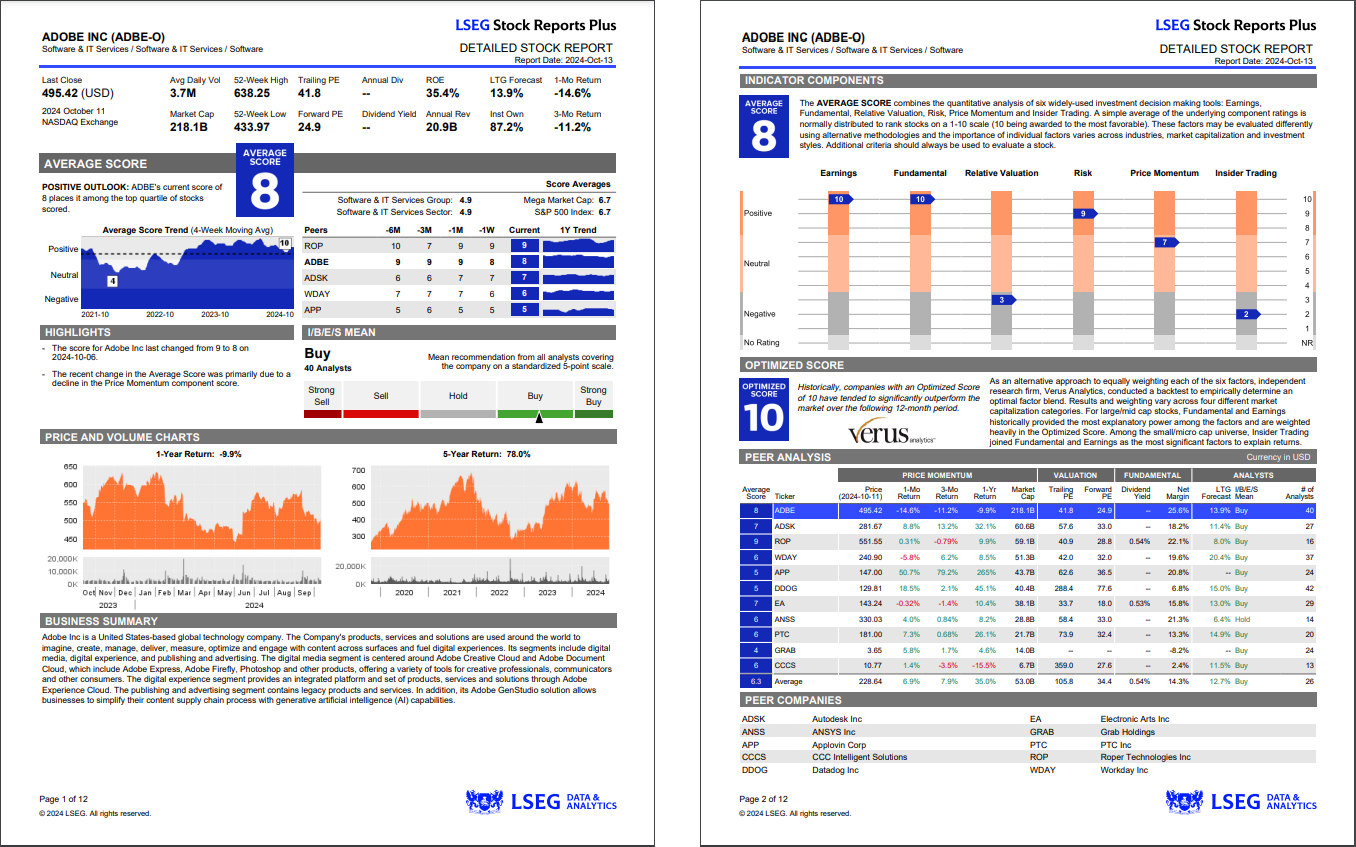
Two search Report Layouts are available with one displaying the overall rating and general company information, and the second showing the full rating details across each scoring criteria. Use the PDF icon under Rating Report in the far-right column to select a report.
Supply Chain
Search for company products and services as well as across sectors and industries for company participants and tradenames. Note: Supply chain data is an add-on service which is only available under additional subscription terms.
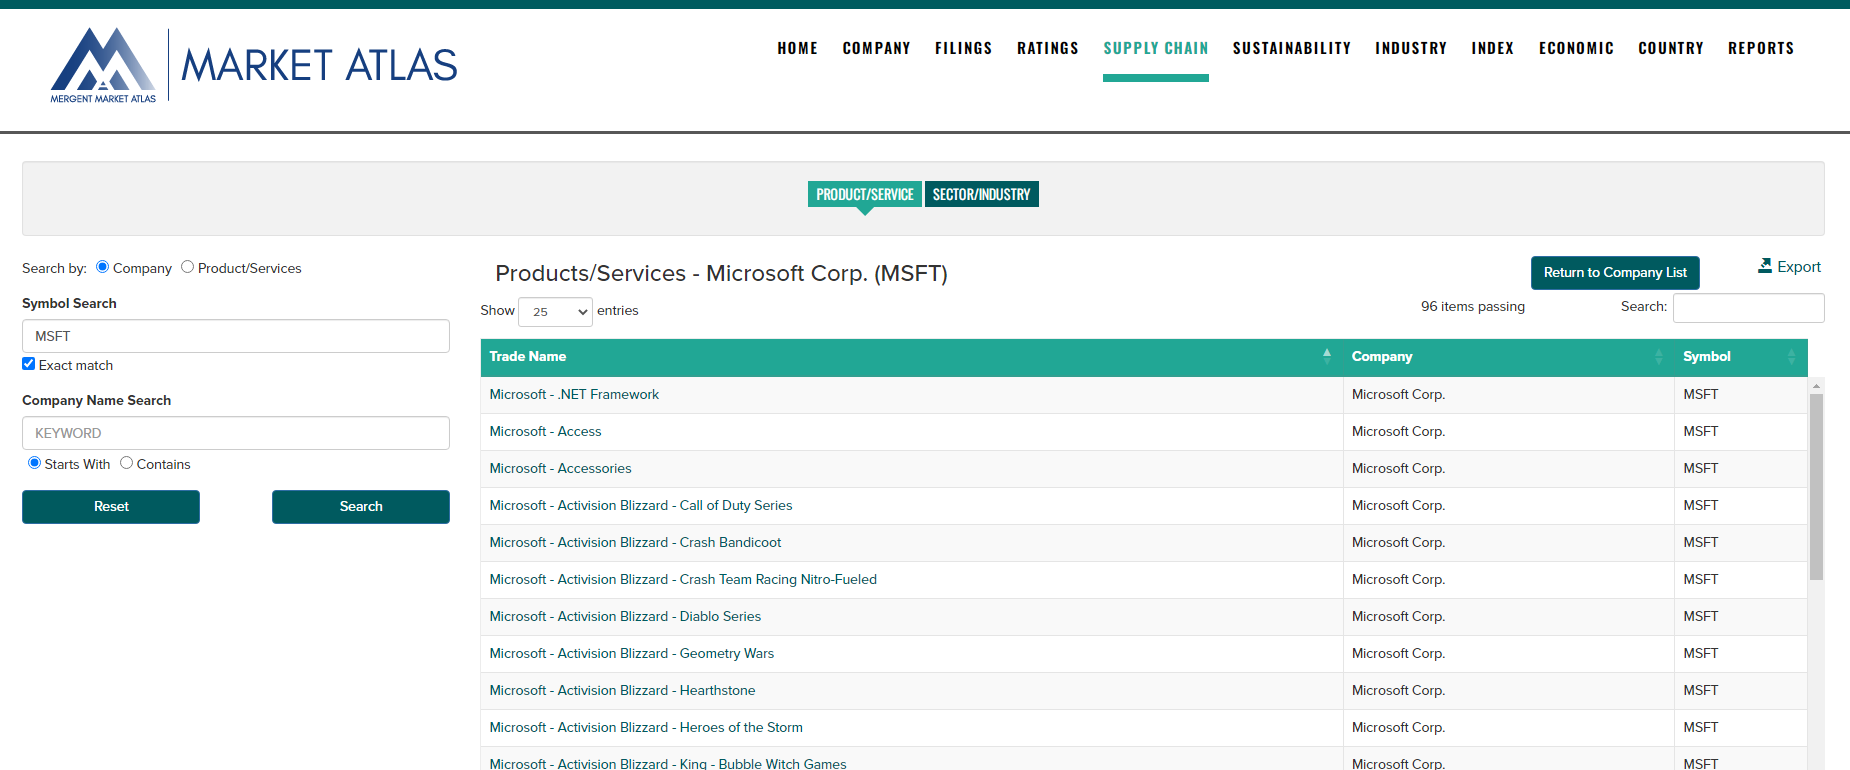
Product/Service Search
- Enter a company ticker search by company name in the left hand navigation bar.
- Search results display a listing of company products and services under the Tradename heading.
- Use the Export button to export the results to a CSV file.
- Click on a Tradename to advance to the Company Products & Services page where more details on sectors and competing products can be found.
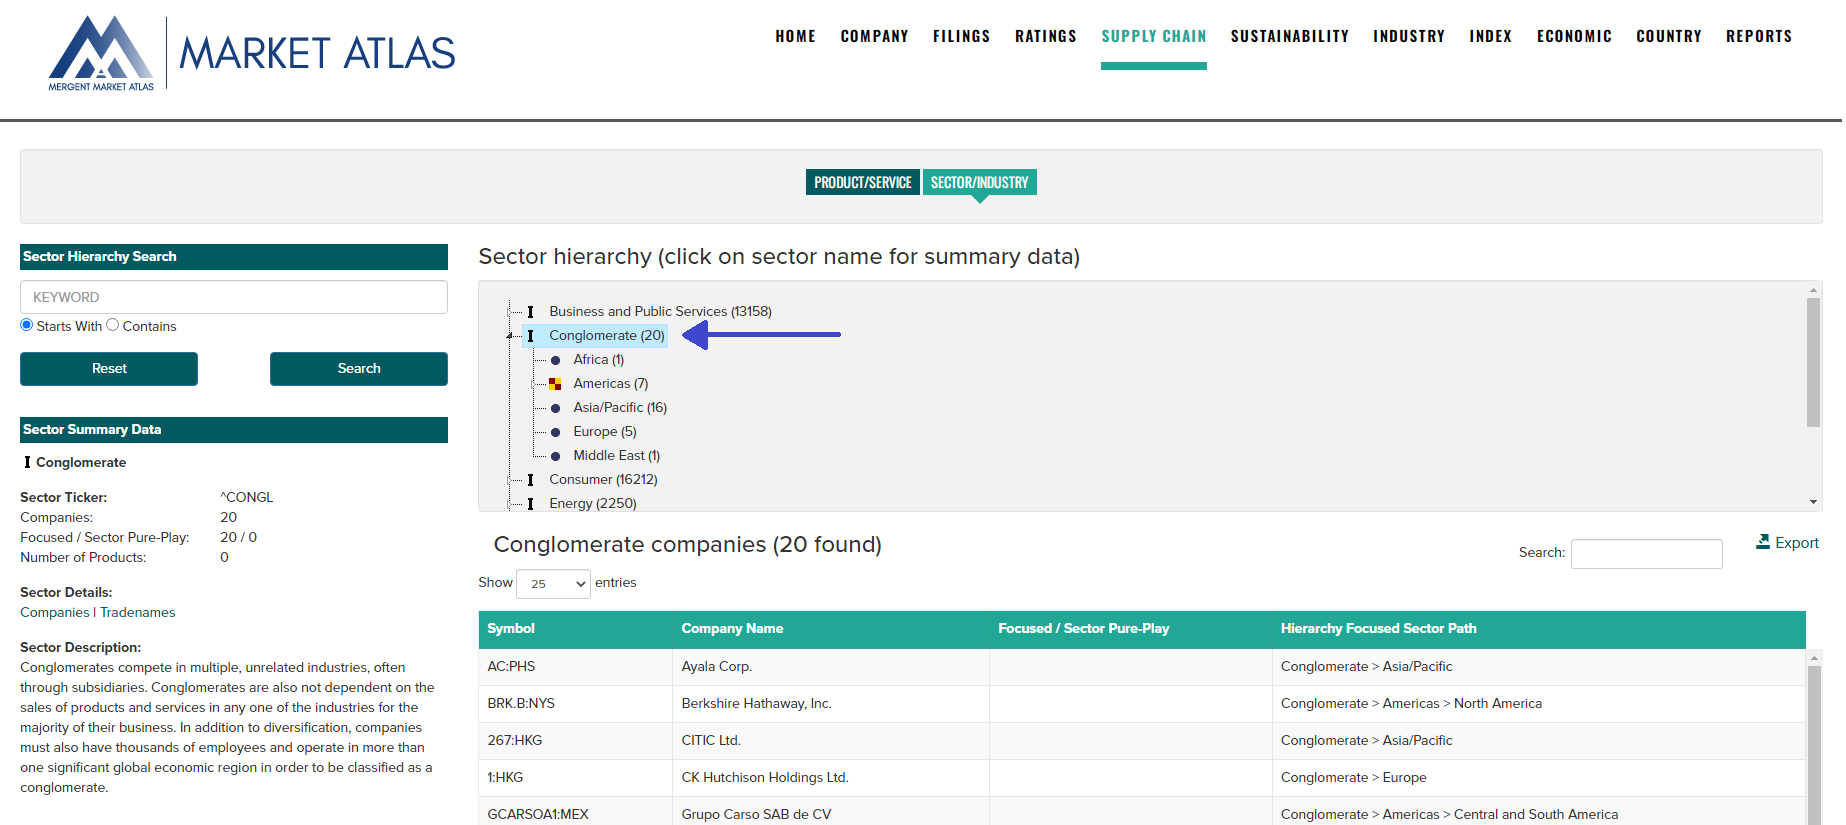
Sector Hierarchy Search
- Use the Sector Hierarchy Search on the left-hand navigation bar to search for a specific sector name.
- Click on a sector name to view Sector Summary Data and a list of companies falling under the category.
- Use the Export button to export the results to a CSV file.
- Double-click on a sector name to drill down to the next level of more specific sector categories.
Sustainability
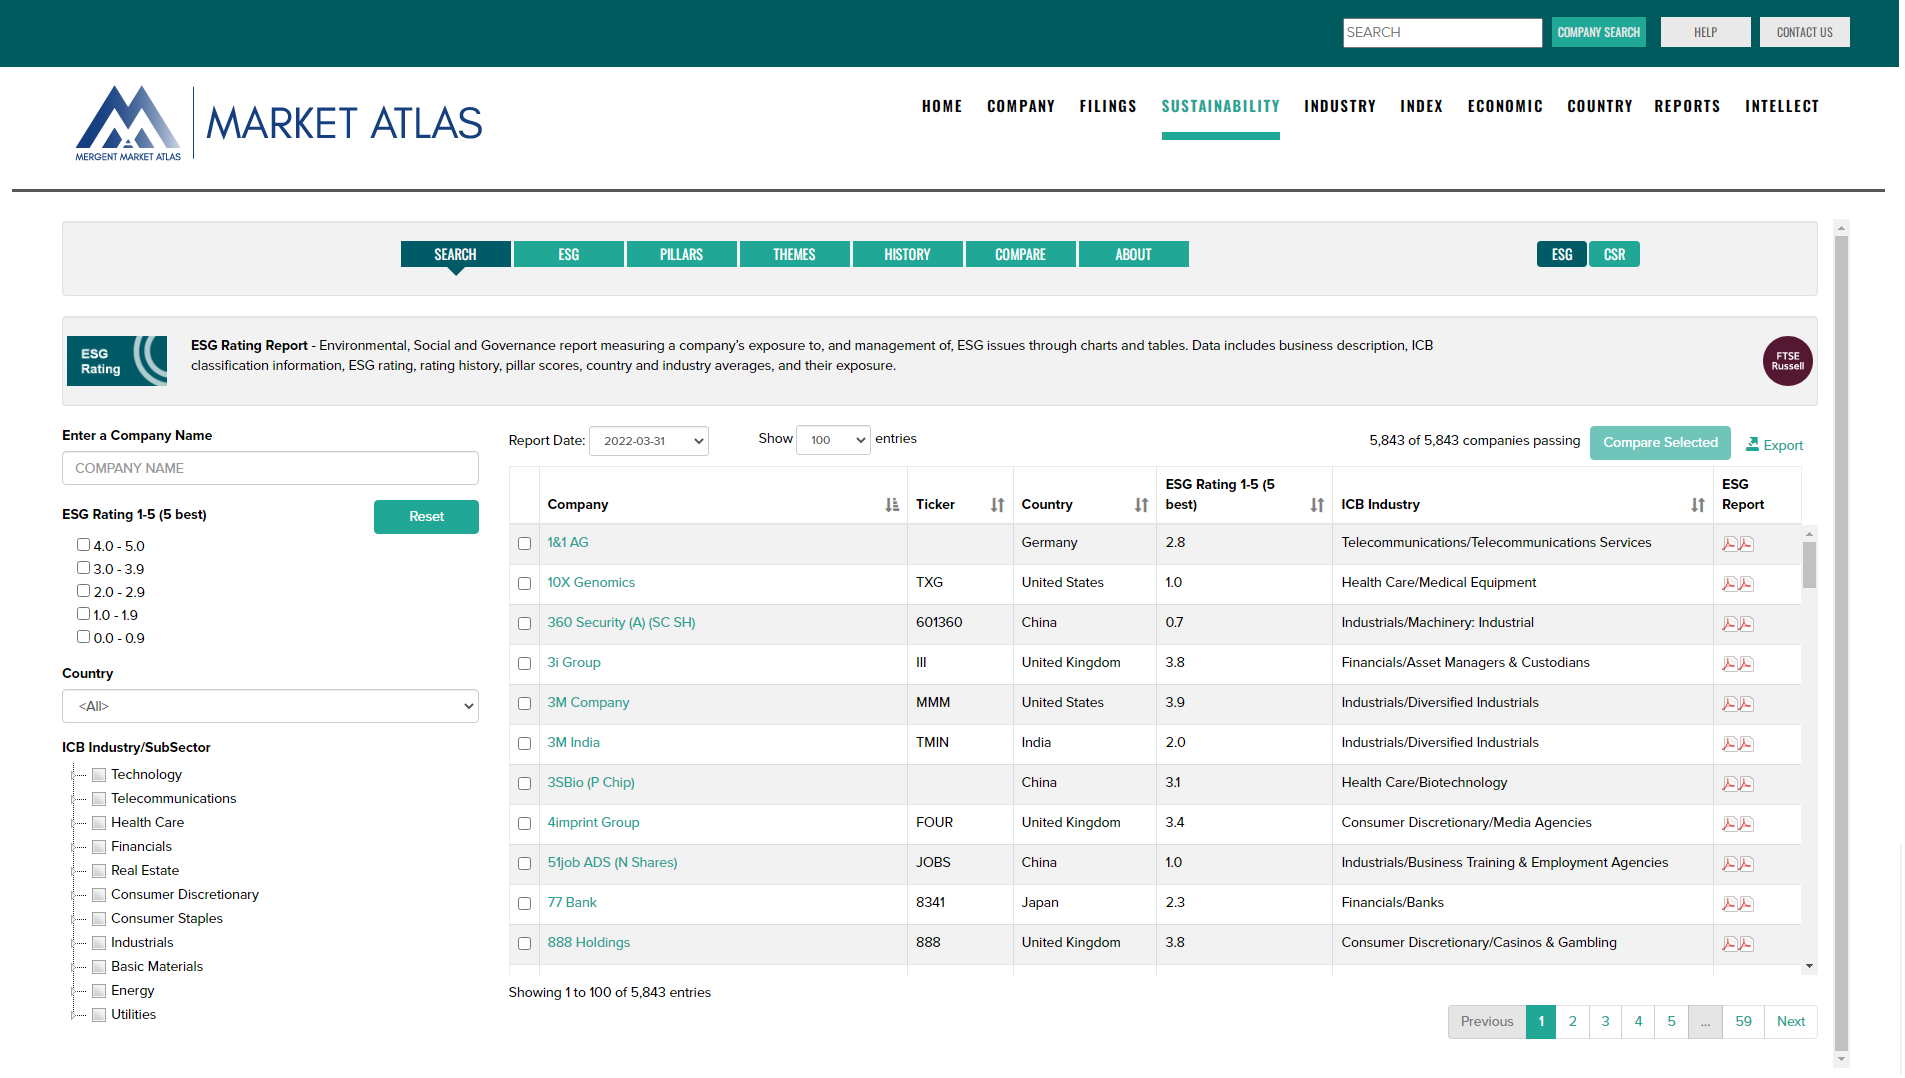
Search for FTSE Russell ESG Rating reports which measure a company's Environmental, Social, and Governance risk. Coverage includes over 7,000 securities across 47 Developed and Emerging markets. ESG Ratings represent an overall score that breaks down into underlying Pillar and Theme Exposures and Scores. Pillars and Themes are built on over 300 individual indicator assessments that are applied to each company's unique circumstances. To learn more about ESG Ratings, visit https://www.ftserussell.com/data/sustainability-and-esg-data/esg-ratings
ESG Ratings reports include business description, ICB classification information, ESG rating, rating history, pillar scores, country and industry averages, and their exposure.
- Use the left navigation controls to filter the ESG ratings data based on company name, ESG rating range, country or ICB Industry or Sub-Sector
- Use the Report Date dropdown to choose a reporting period.
- Use the Export button to export filtered data to a CSV file.
- Click on report headings to sort the data.
- Select companies with the check boxes follwed by the Compare Selected button to view ESG details in table or chart form.
- Click on the PDF report icons to view the 1 page or 2 page ESG report.
Sustainability Definitions
ESG Rating: A measure of the overall quality of a company's management of ESG (Environmental, Social and Governance) issues. The ESG Rating breaks down into underlying Pillar and Thematic Exposures and Scores. Our ESG Rating is based on publicly available information and ratings range from 0 to 5, with 5 representing the best rating.
ESG Pillar: A cumulative score for each Pillar (i.e. Environmental, Social and Governance). Scores range from 0 to 5, with 5 representing the best.
ESG Themes: A total of 14 individual ESG Themes make up FTSE Russell's ESG Data Model. The applicability of each ESG Theme to companies in the research universe is based on how exposed they are to each Theme. These 'Exposure Levels' are based on factors including a company's sector and where it operated geographically.
ESG Rating ICB Supersector Relative Percentile Score: Percentile calculation where 1 equates to a company in the bottom 1% and 100 equates to a company in the top 1%.
ESG Ratings: data structure
The ESG Rating and data model allows investors to understand a company's exposure to, and management of, ESG issues in multiple dimensions. The ESG Ratings are comprised of an overall Rating that breaks down into underlying Pillar and Thematic Exposures and Scores. The Pillars and Themes are built on over 300 individual indicator assessments that are applied to each company's unique circumstances.
Industry
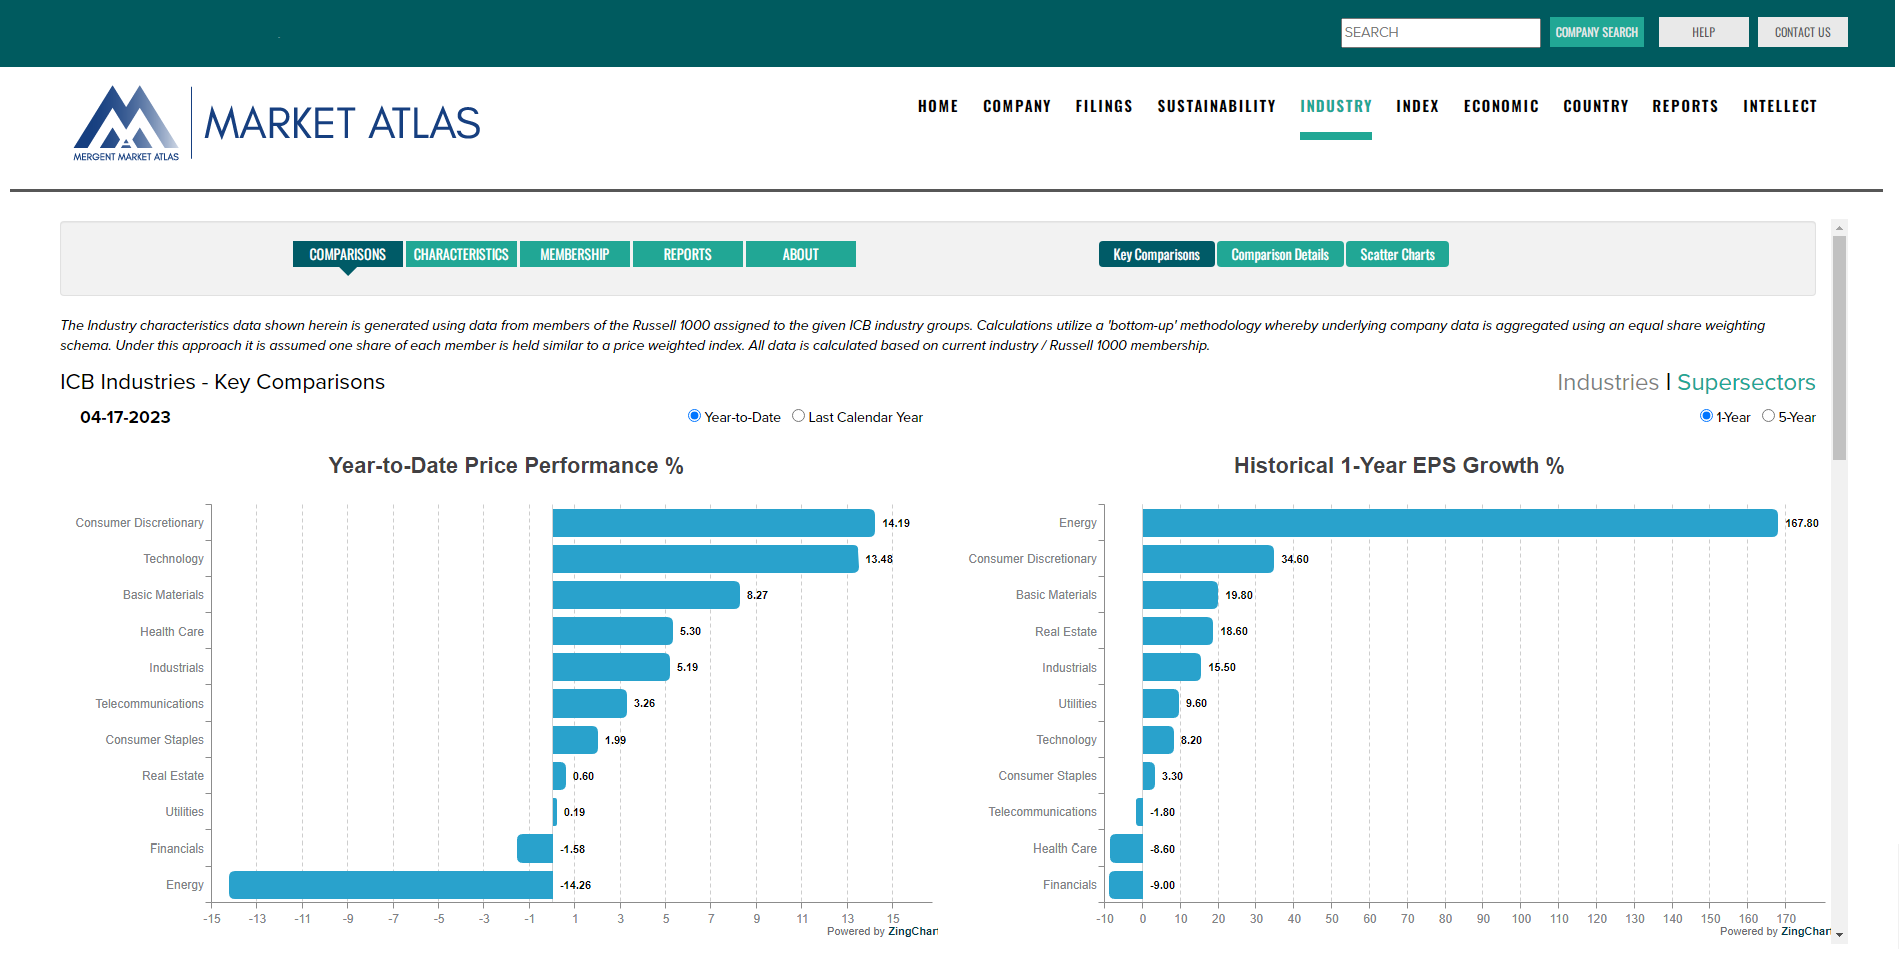
View industry characteristics generated using an equal weighted 'bottom-up' methodology based on members of the Russell 1000 and the ICB industry classification system. Compare ICB Industries and Supersectors across growth, profitability and valuation themes. View underlying member data reports for each ICB group. Access PDF reports covering each ICB Industry and Supersector. All data regenerated nightly using the latest underlying company pricing and financials.
View bar charts of Key Comparison data, use the Industries/Supersector toggle to alternate chart contents.
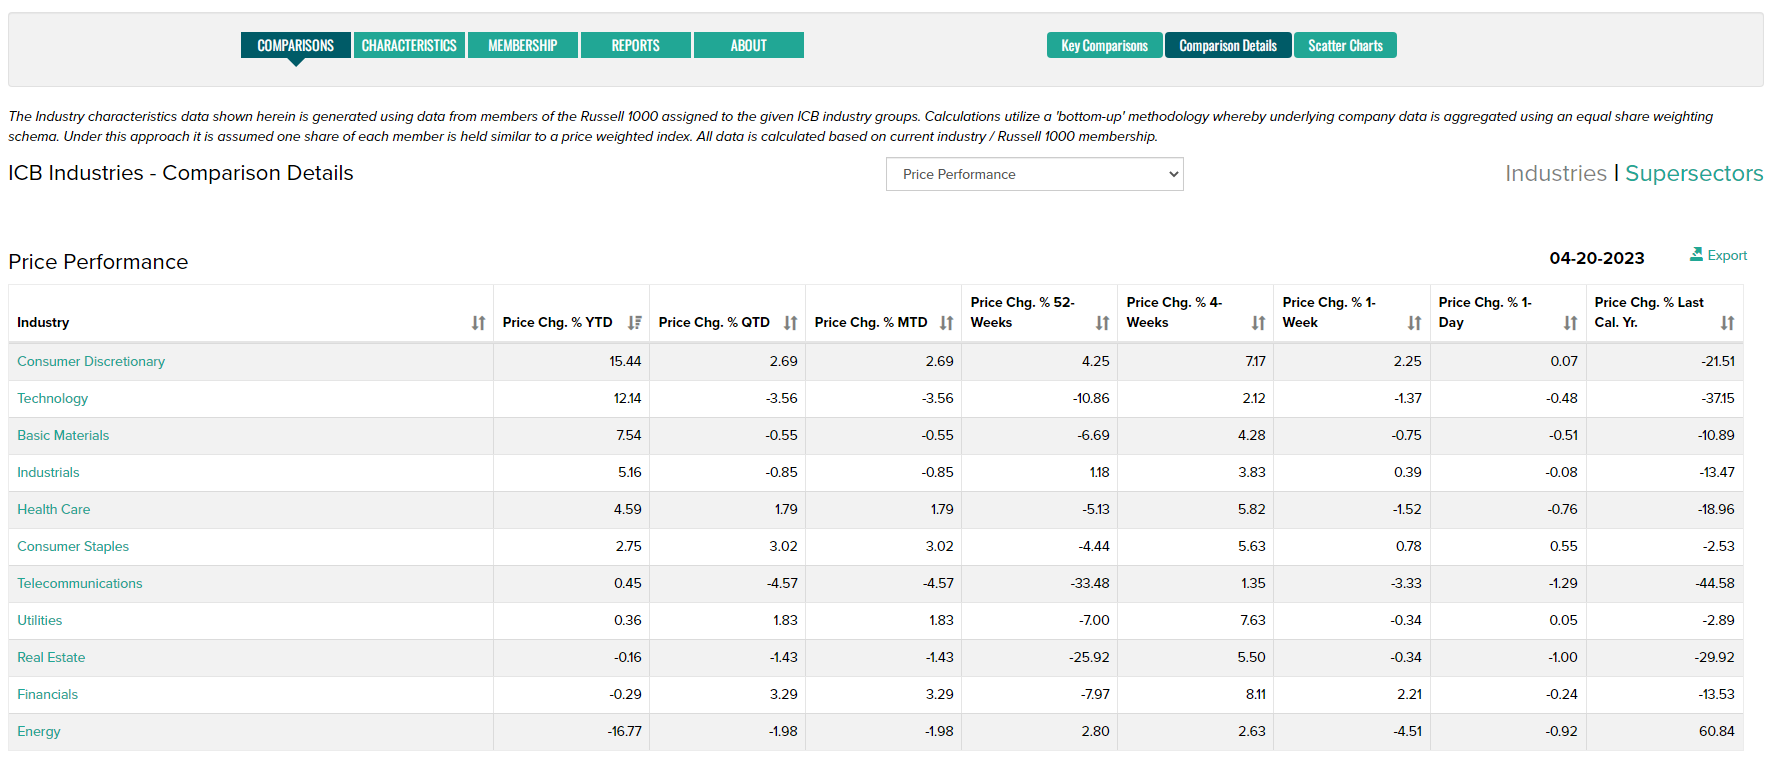
View Comparison Details as displayed through tabular data reports. Use the Industries/Supersector toggle to alternate table contents. Use the drop-down selector to change the report theme (Price Performance, Growth, Profitability, Valuation, Debt Ratios). Use the Export button to create a CSV file.
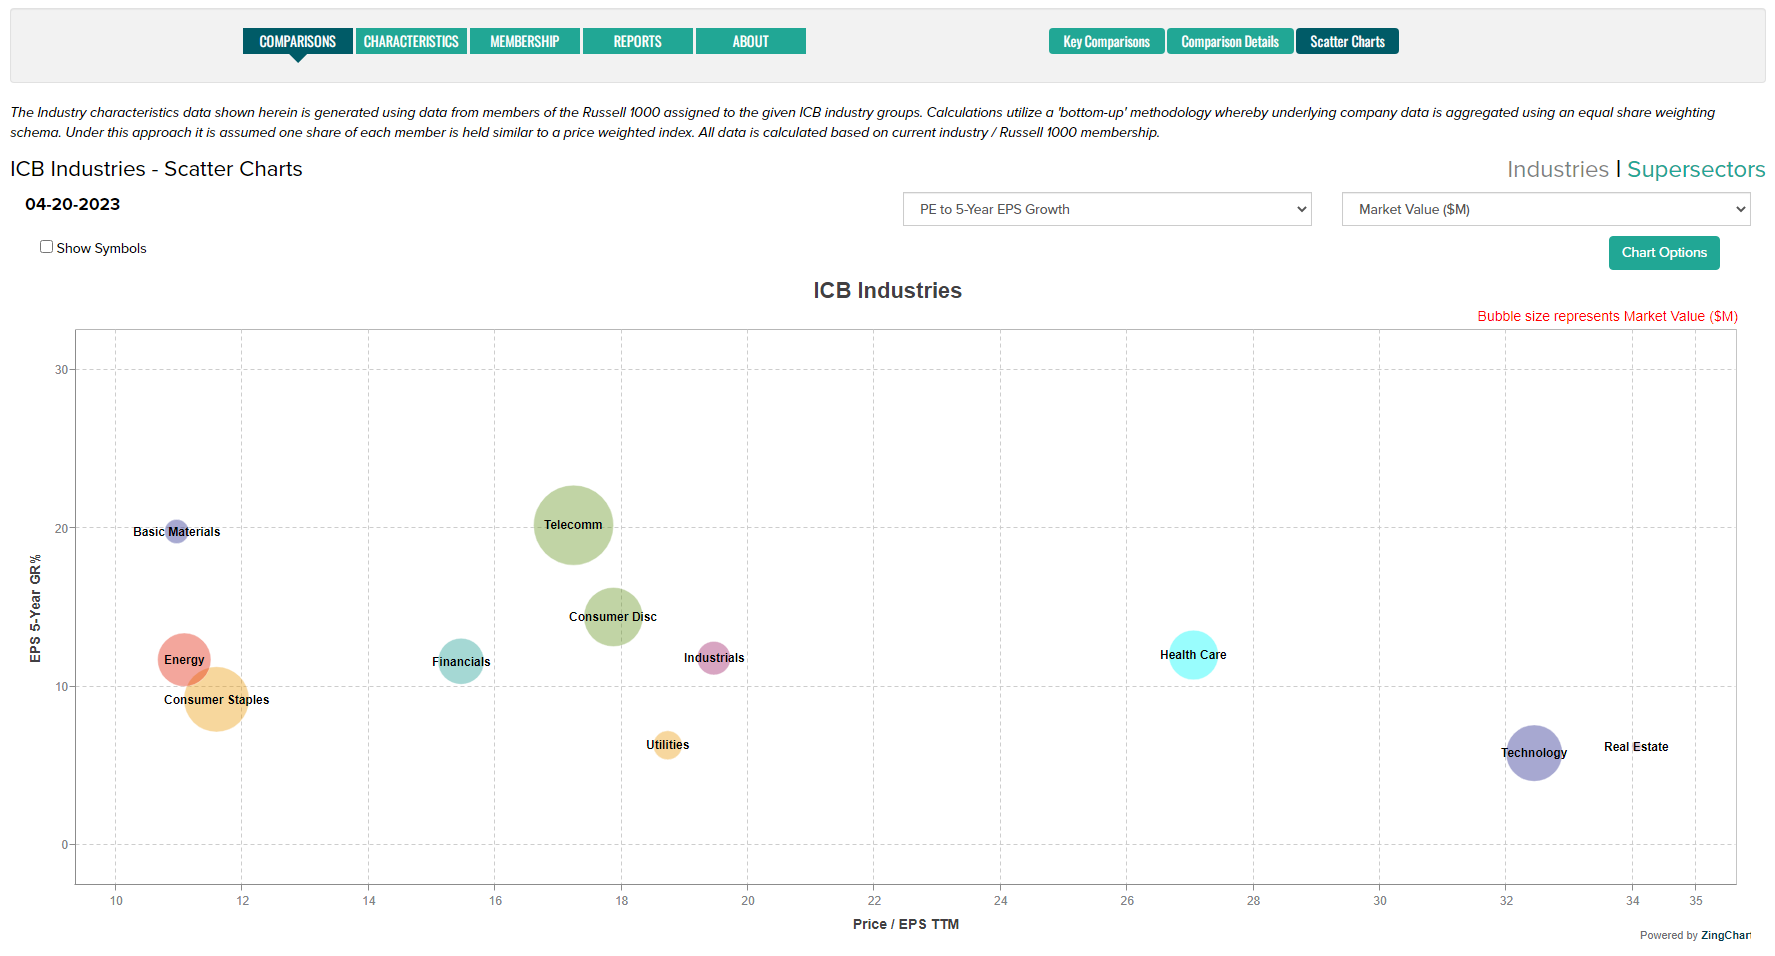
Compare Industries and Supersectors using Scatter Charts. Select scatter chart combinations and bubble size variables with drop-down selectors.
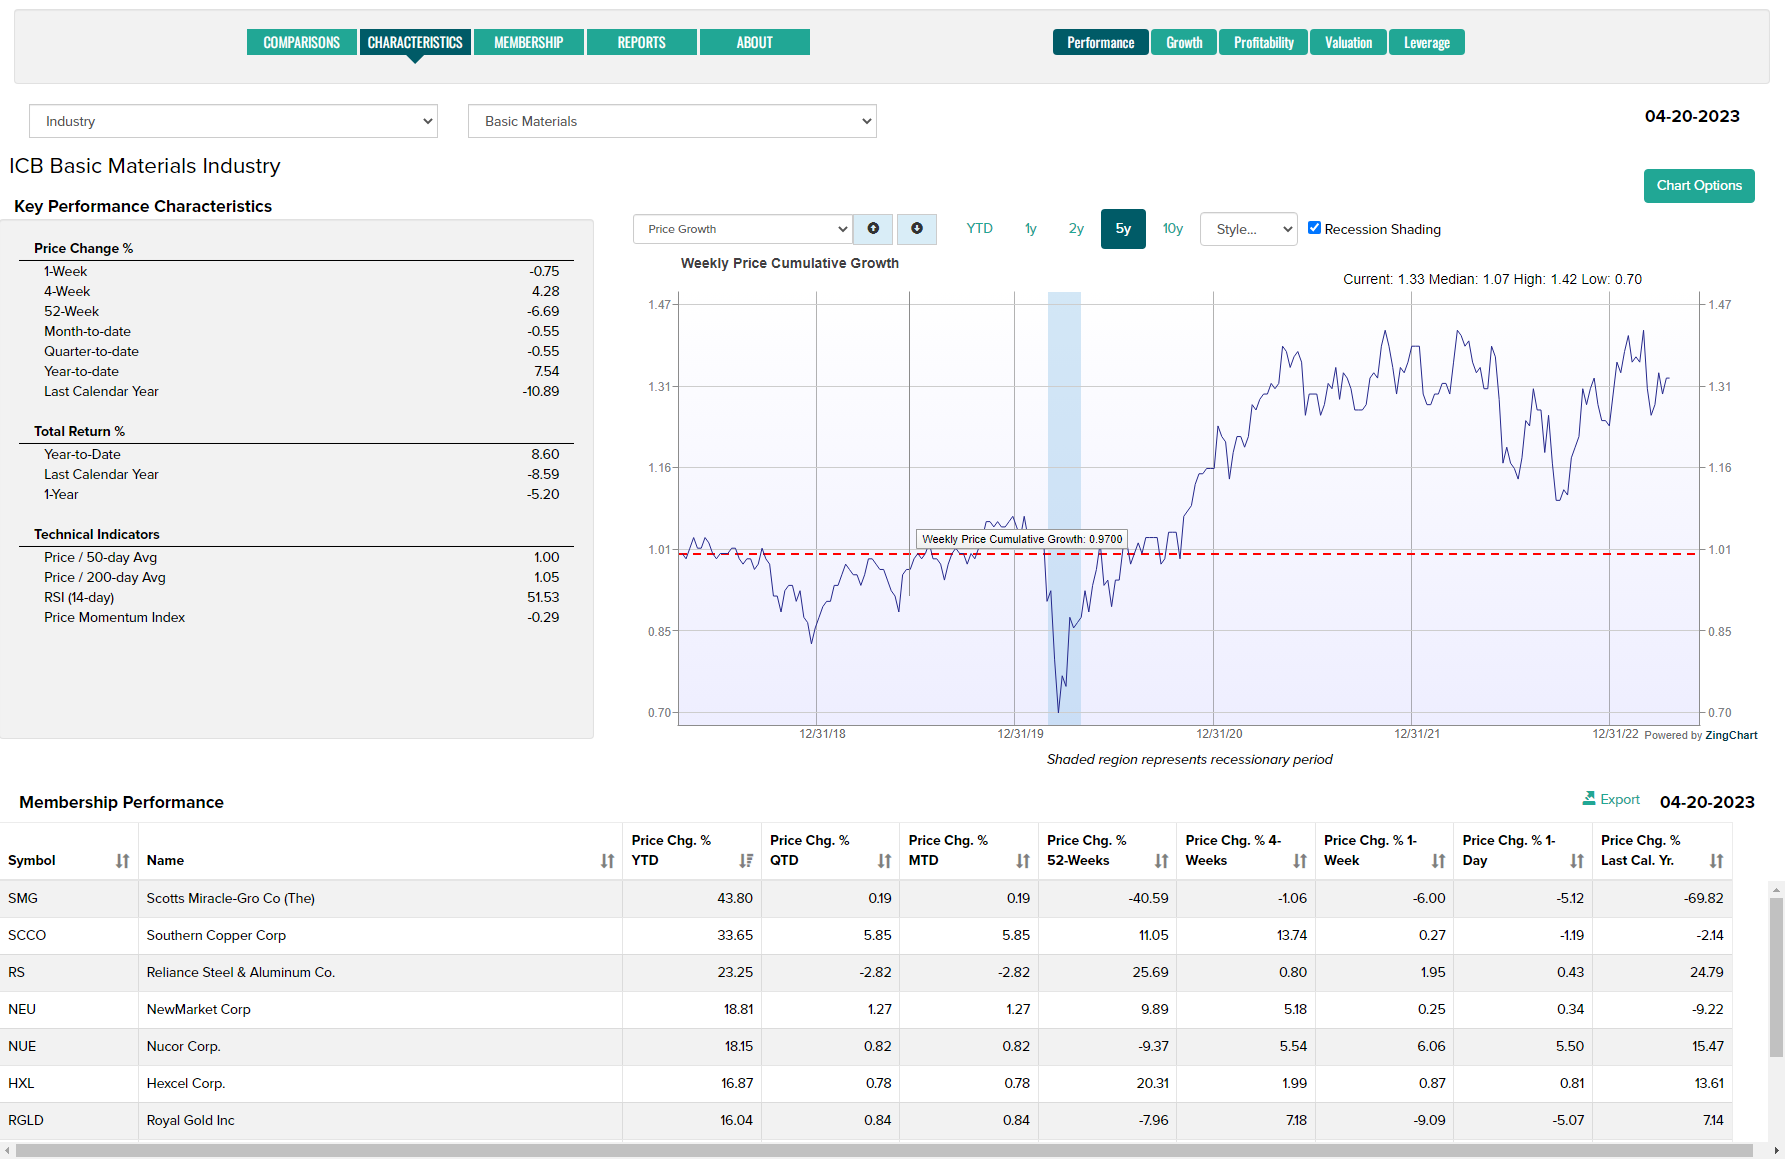
Drill into the analysis of individual Industries and Supersectors from the Characteristics tab. Use the Performance, Growth, Profitability, Valuation and Leverage tabs to select analysis themes. Use the drop-down selectors to choose an industry group. Scroll down to view underlying membership data.
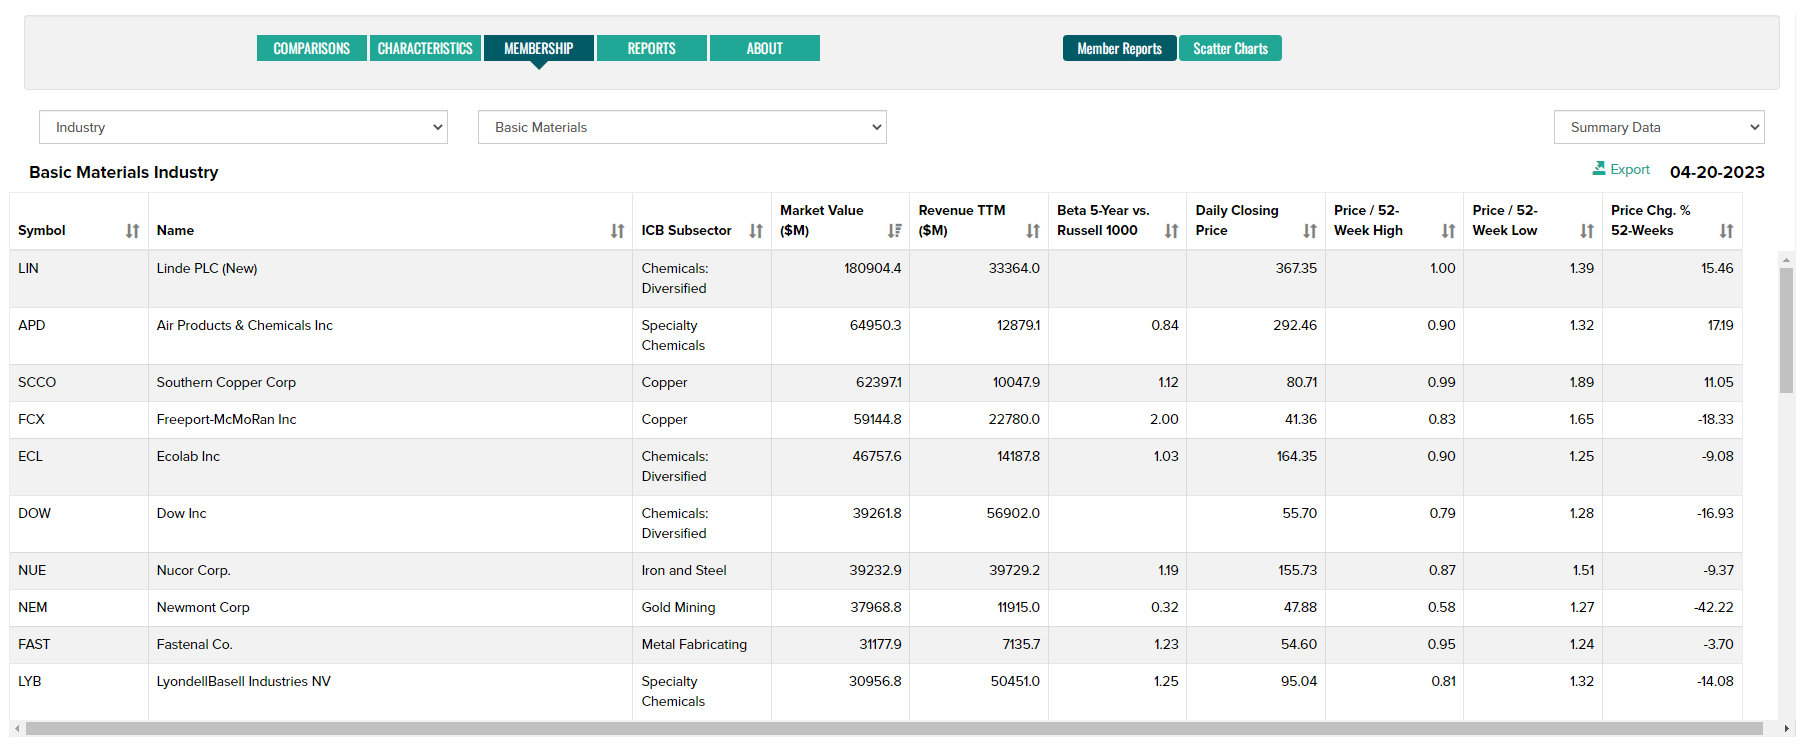
Use the Membership tab to view Reports and Scatter Charts on Industry and Supersector members. Use the drop-down selector to change report contents and the Export button to create a CSV file.
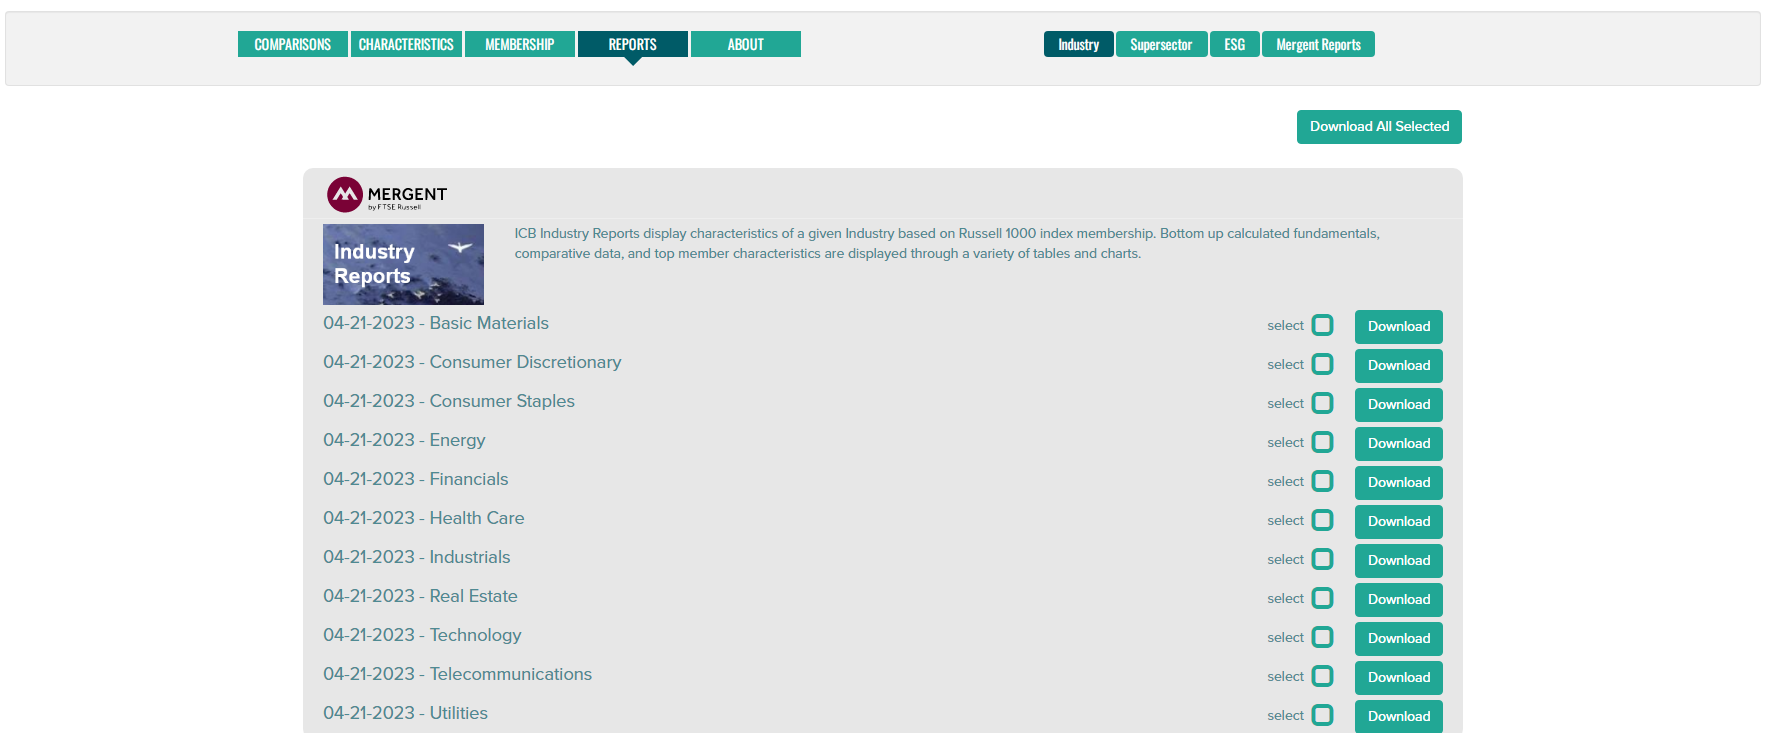
Download Industry PDF reports from the Reports tab.
Index
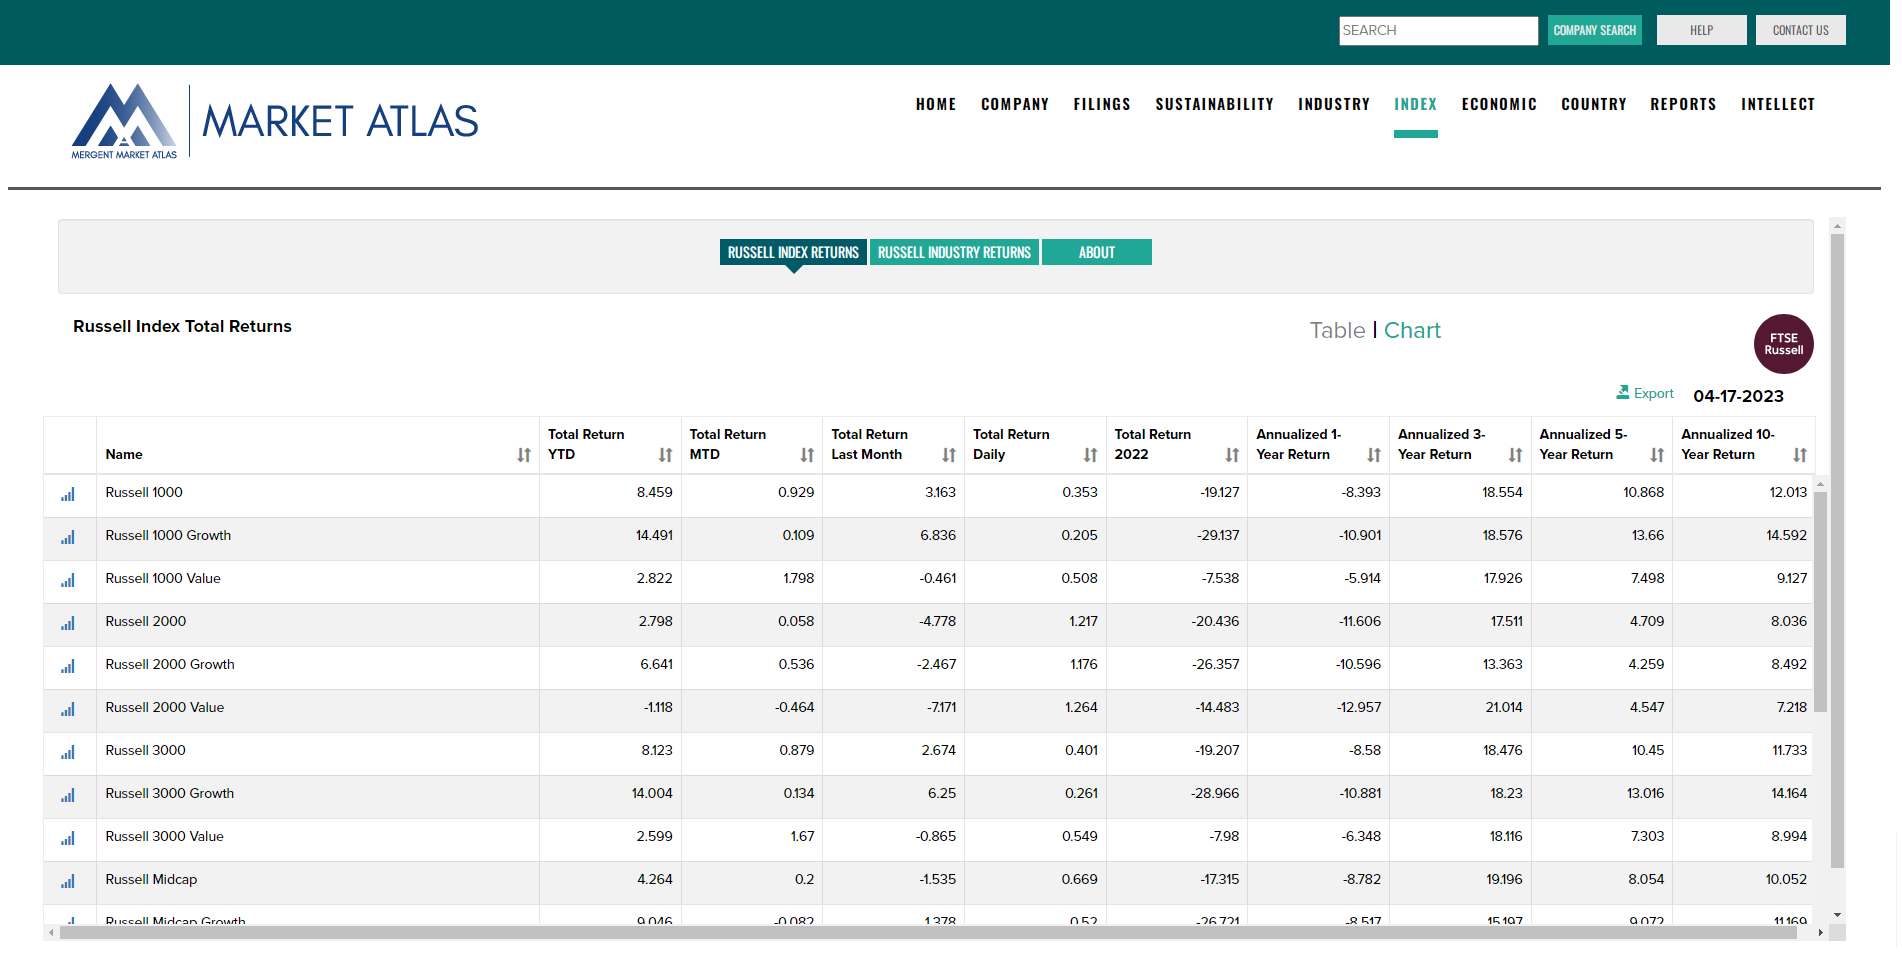
View Russell Index total return data and charts using the Russell Index Returns tab. Use the Table/Chart toggle to change the view format. Use the Export button to create a CSV file.
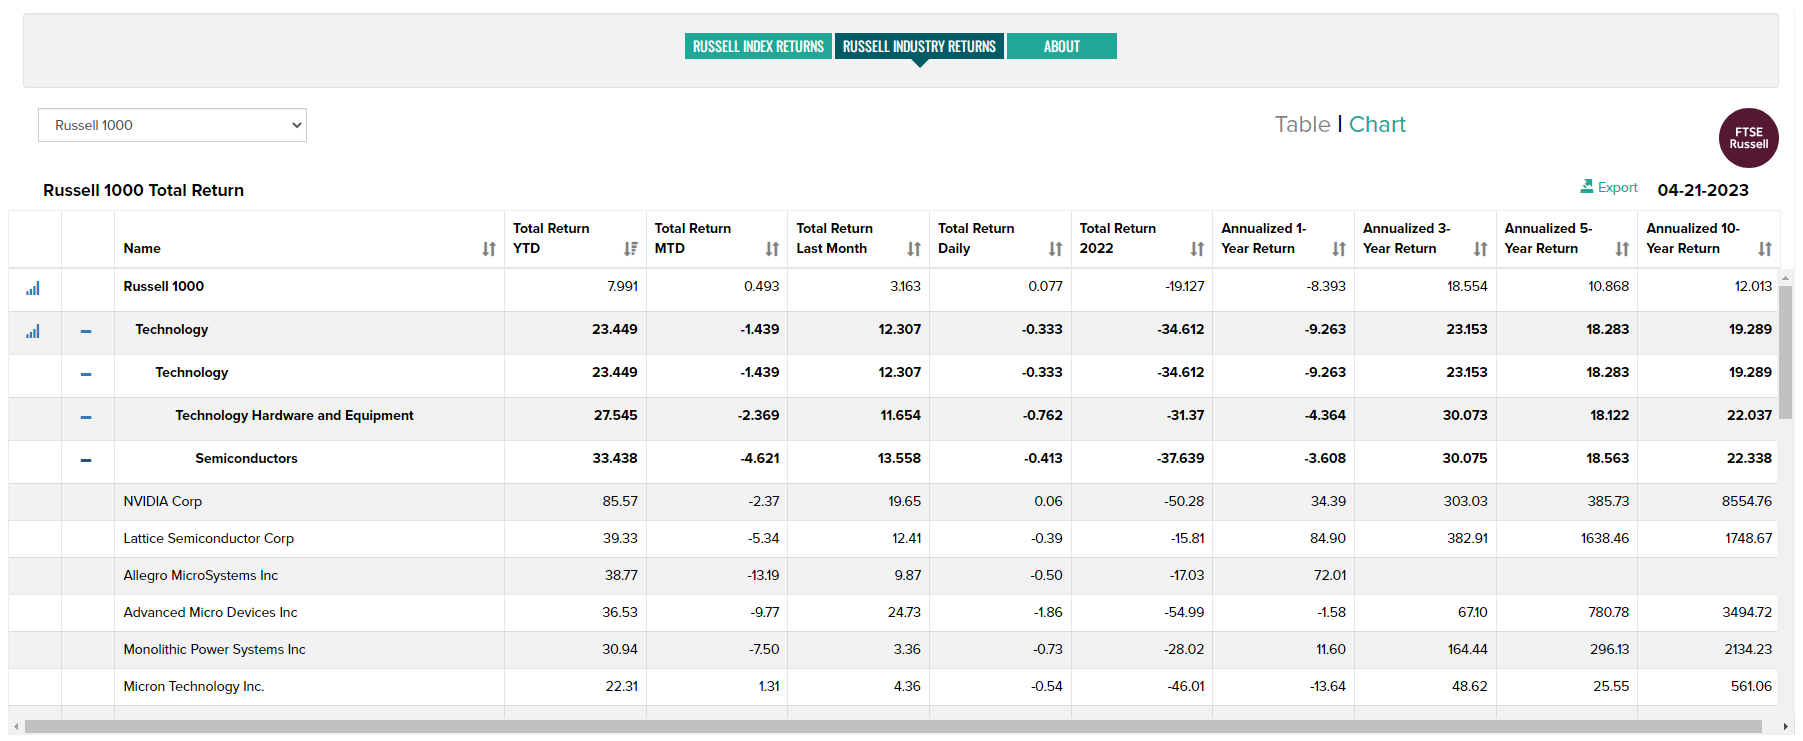
Use the Russell Industry Returns tab to view ICB Industry total returns based on Russell Indexes. Use the drop-down selector to choose an Index. Click on the bar chart icon to view a chart.

Use the +/- icon to expand/contract industry sub-groups.
The Russell US Indexes, from mega cap to microcap, serve as leading benchmarks for institutional investors. The modular index construction allows investors to track current and historical market performance by specific market segment (large/mid/small/micro cap) or investment style (growth/value/defensive/dynamic). All sub-indexes roll up to the Russell 3000© Index. The Russell US Indexes can be used as performance benchmarks, or as the basis for index-linked products including index tracking funds, derivatives, and Exchange Traded Funds (ETFs).
For more information on Russell Indexes click here.
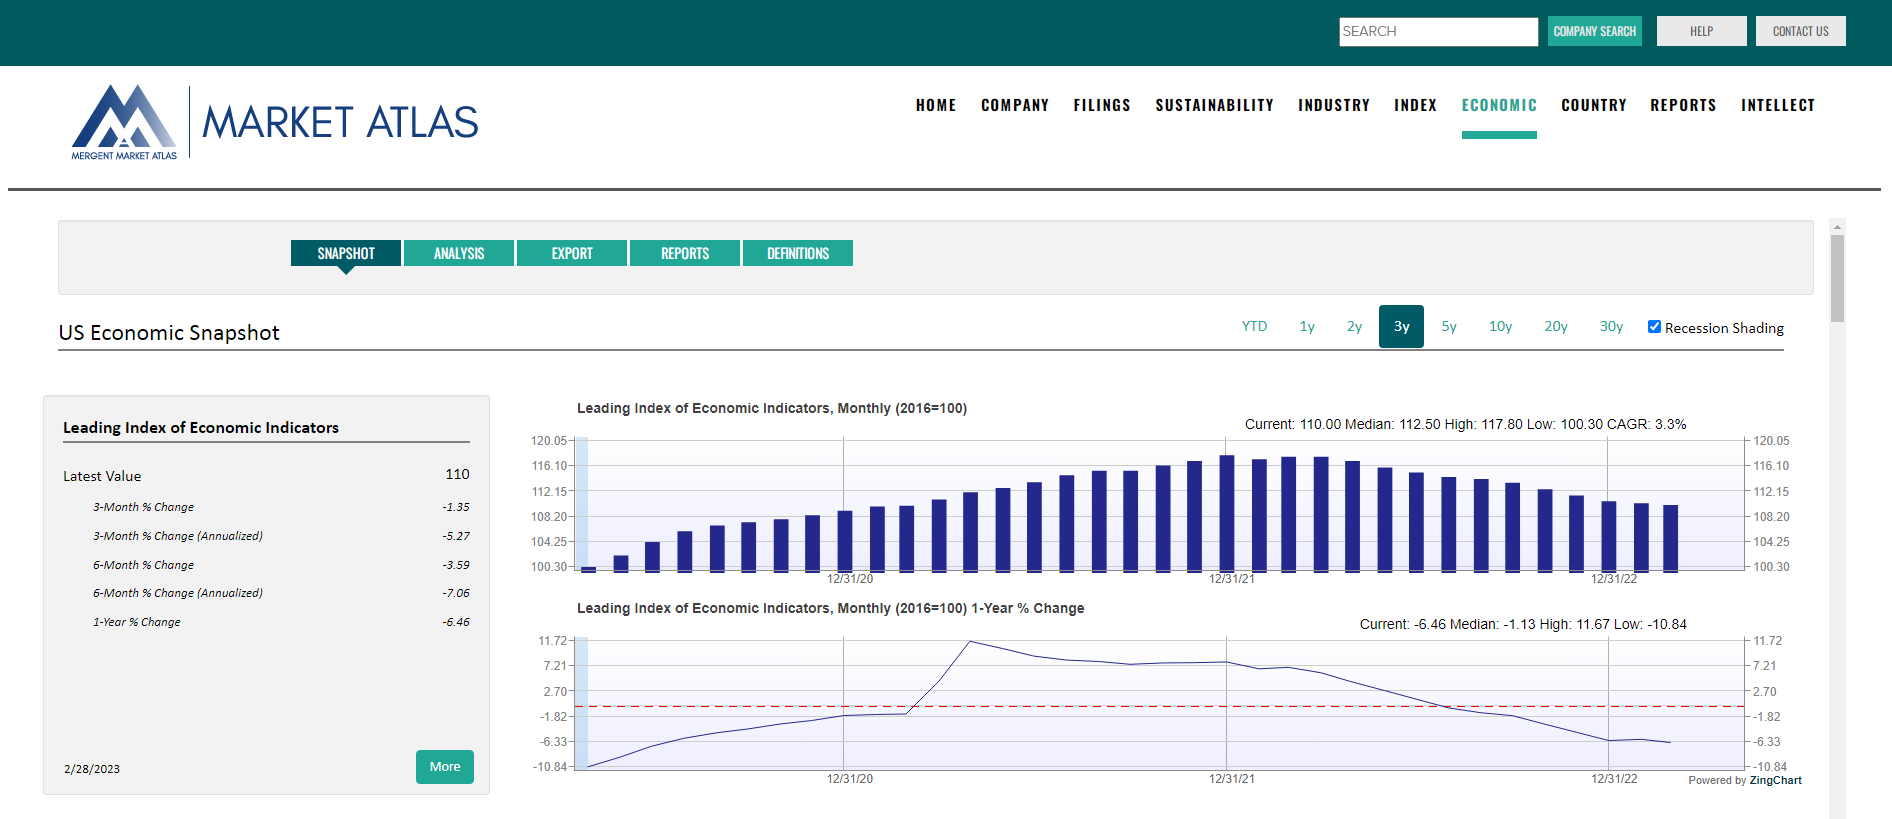
Economic
Coverage of a wide array of macroeconomic time series data including leading economic indicators, GDP, employment, consumer and producer price indexes, consumer confidence measures, consumption, production, manufacturing and housing activity.
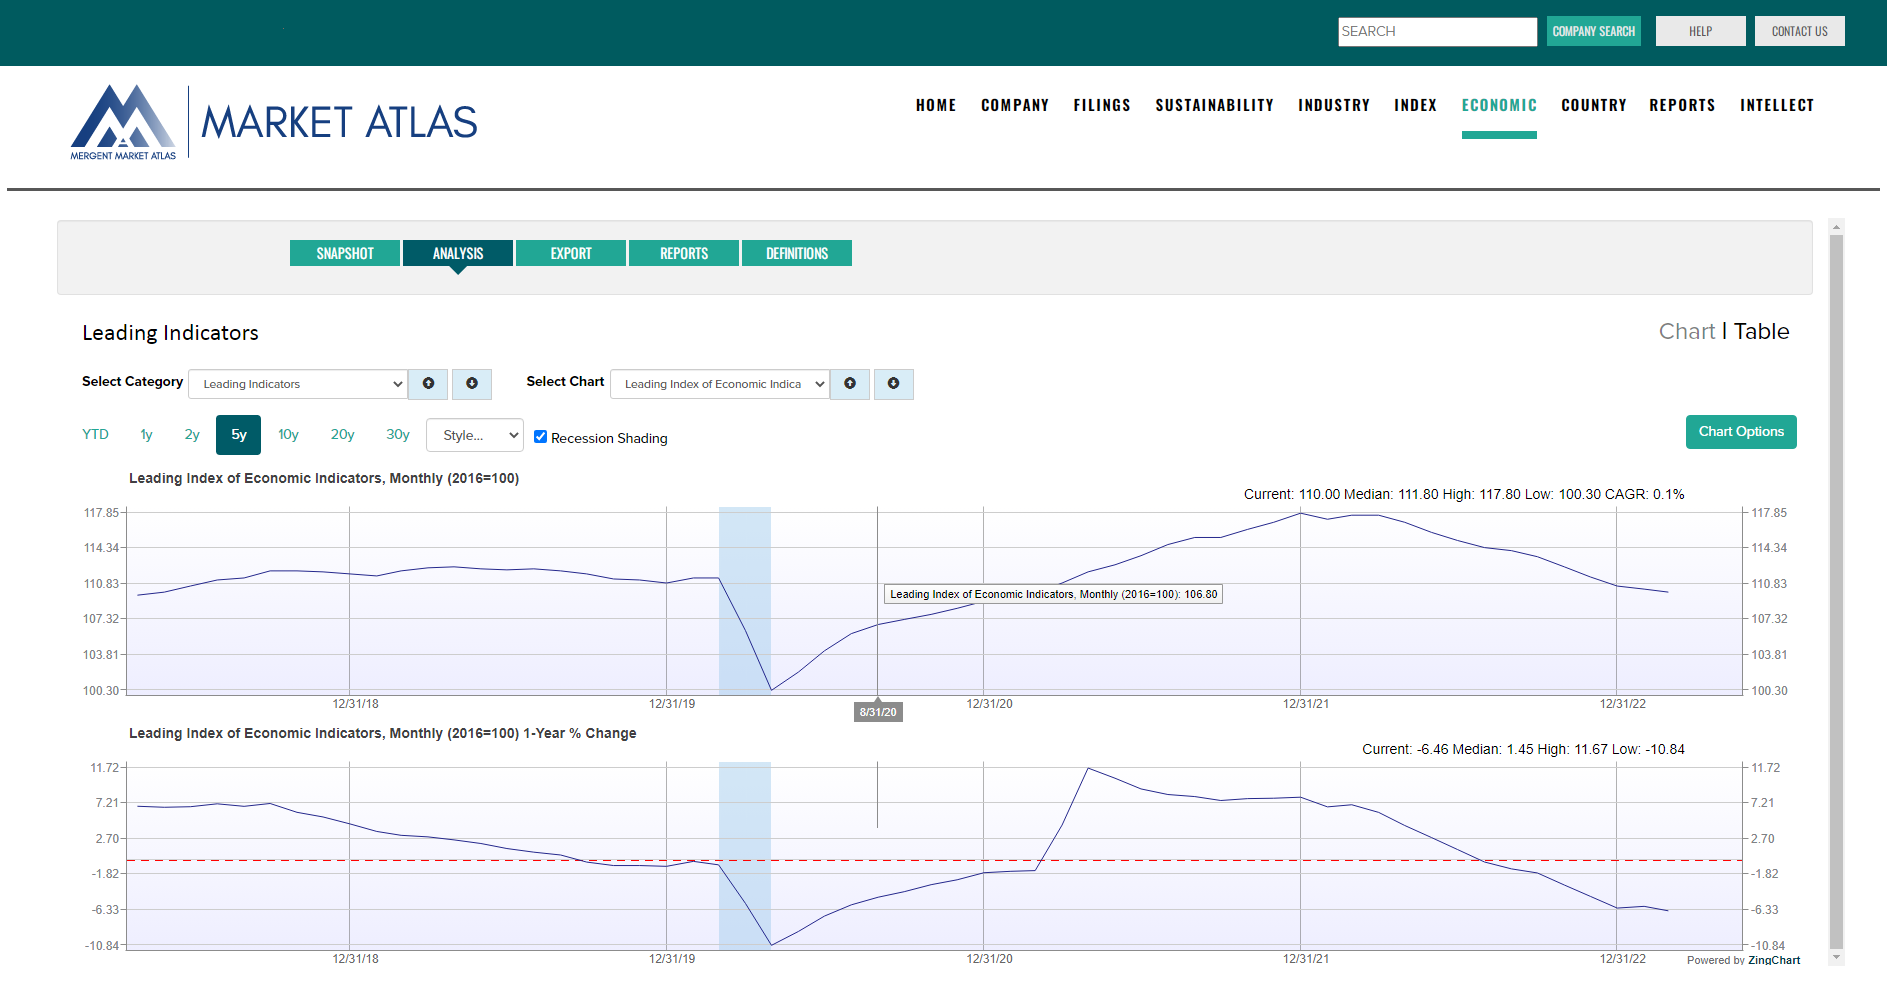
Start with an overview of key economic timeseries then drill into specific areas of interest for more detail.
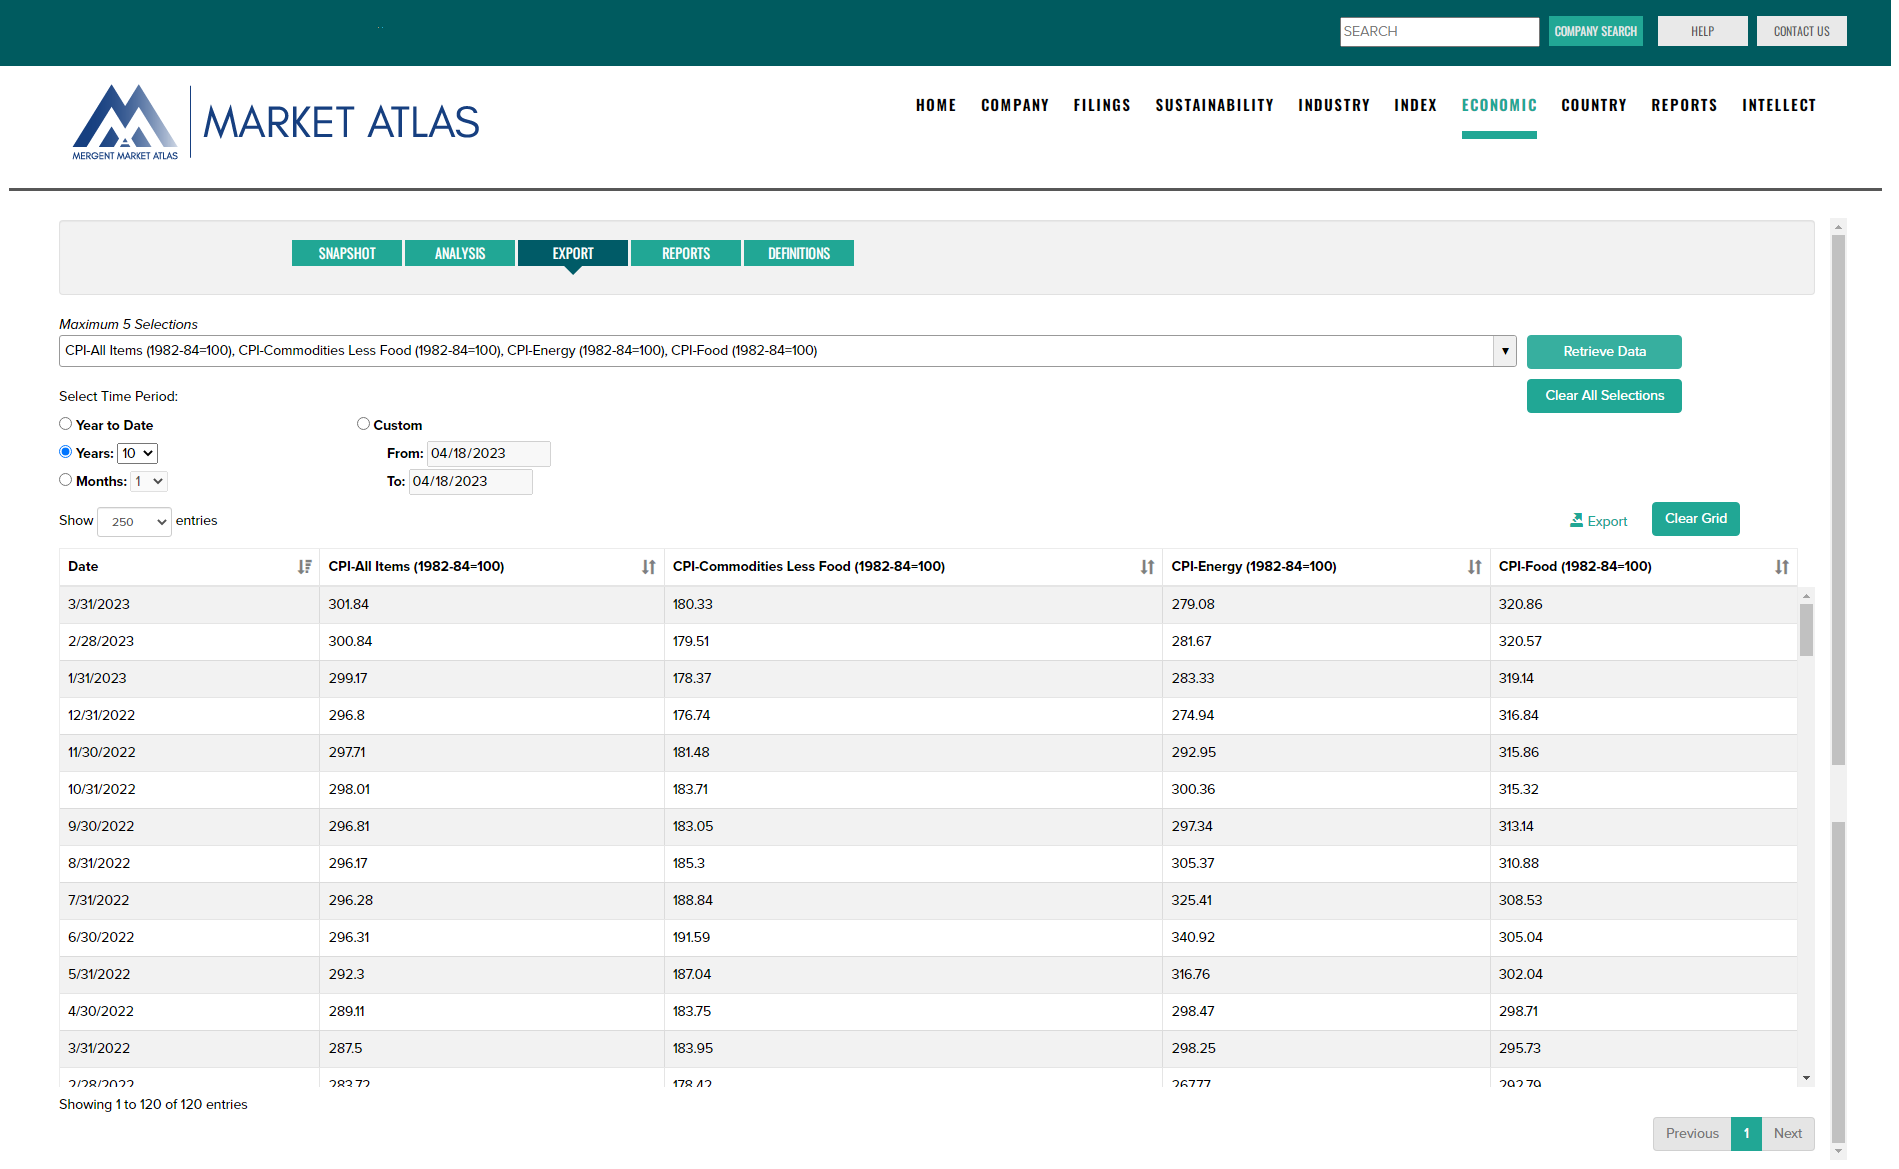
View raw and percent change data charts over multiple economic cycles. Customize chart formats and export the results.
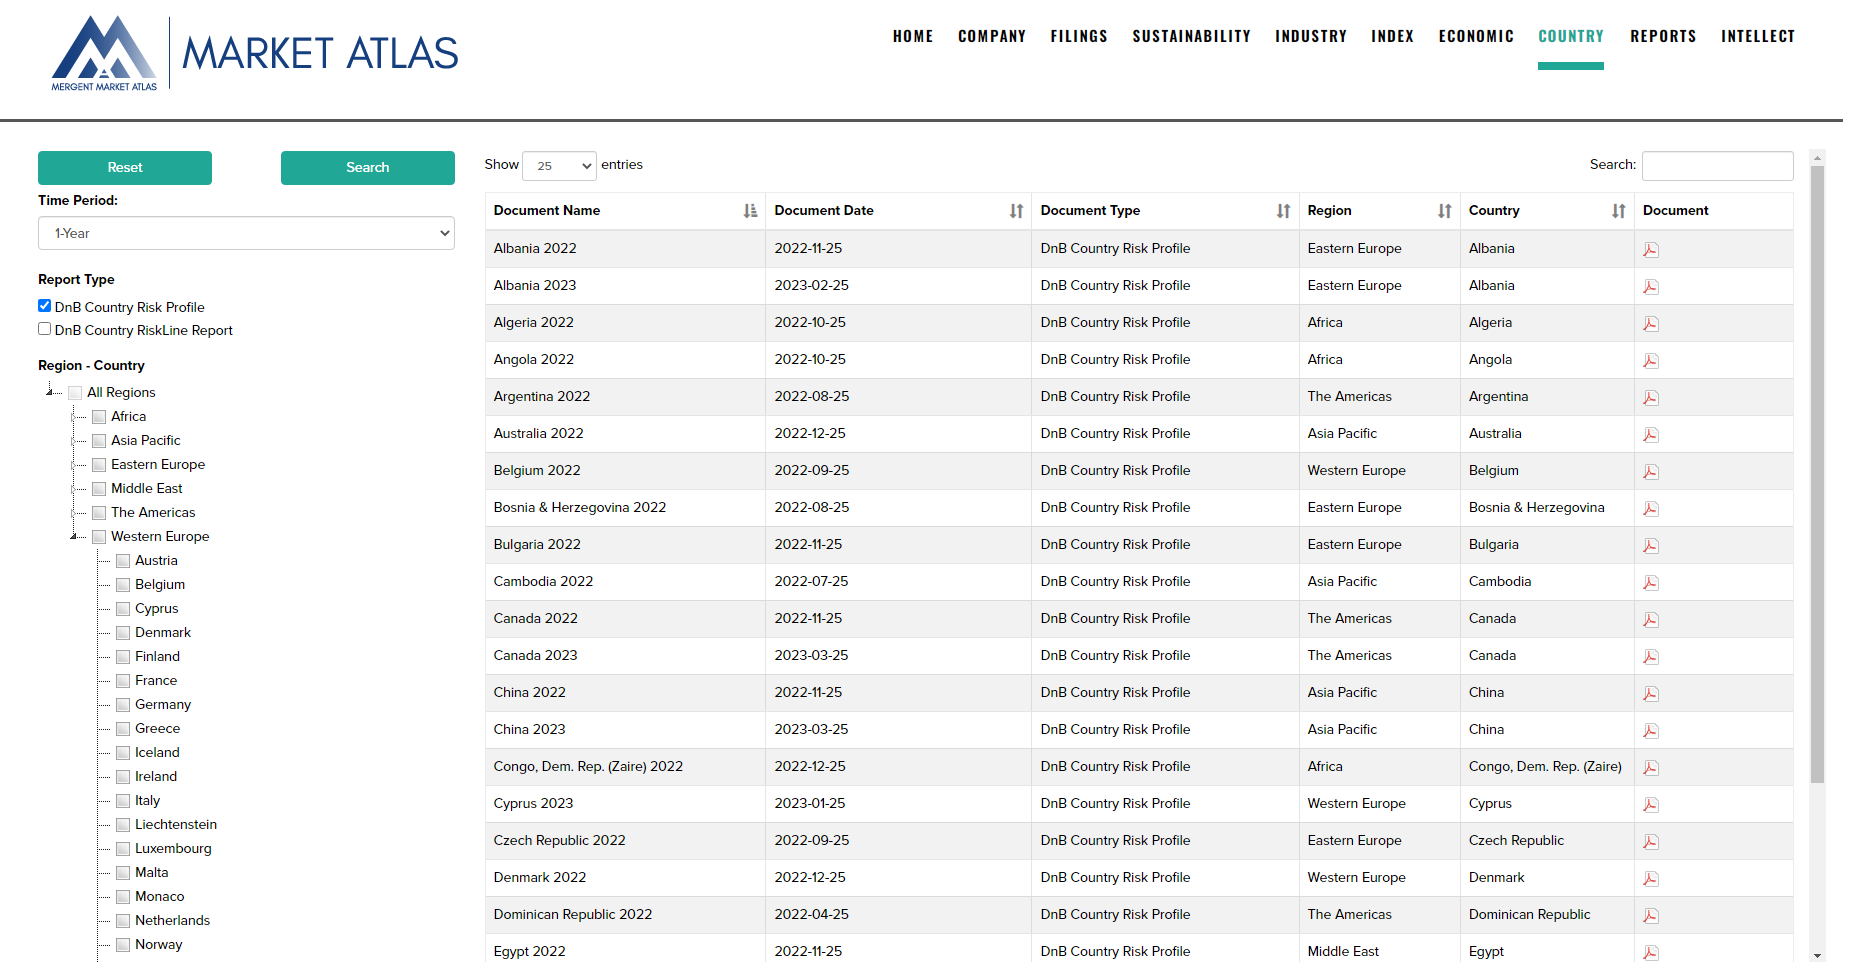
Country
Access current and historical D&B Country Risk Profile and D&B Country RiskLine PDF reports.
D&B Country Risk Reports review in detail country risks such as political unrest, economic crises and natural disasters.
D&B Country RiskLine Reports include selected country risk information and provide a concise risk indicator that assesses the risk of doing business in a country, given its economic, political and commercial situation.
Report search options include:
- Time period.
- Report type.
- Region/Country (drill down from the default Regions to view Country selection options as shown for Western Europe below).
Reports
Search and download PDF reports based on company fundamentals, rating score, industry, country, sustainability, and economic data. Design custom reports based on selected company content.
Report types include:
- Three forms of company fundamental reports featuring varying levels of financial and reference data detail.
- Proprietary stock rating reports which analyze key trends in earnings, fundamentals, relative valuation, price momentum, risk and insider trading.
- Company Sustainability reports measuring management and exposure to Environmental, Social and Governance issues.
- Company Annual reports.
- Custom designed reports based on company content.
- Industry reports showing financial characteristics of ICB industry groups.
Select a report type using the Company, Rating, Sustainability, Annual Reports, Custom Reports and Industry tabs, then search for reports by entering a Company Name or Symbol followed by the Search button. Use the check boxes included with each report type description along with the 'Download All Selected' button to download multiple reports simultaneously.
Intellect
Where entitled, access Mergent Intellect, providing comprehensive business data serving community and academic research needs.